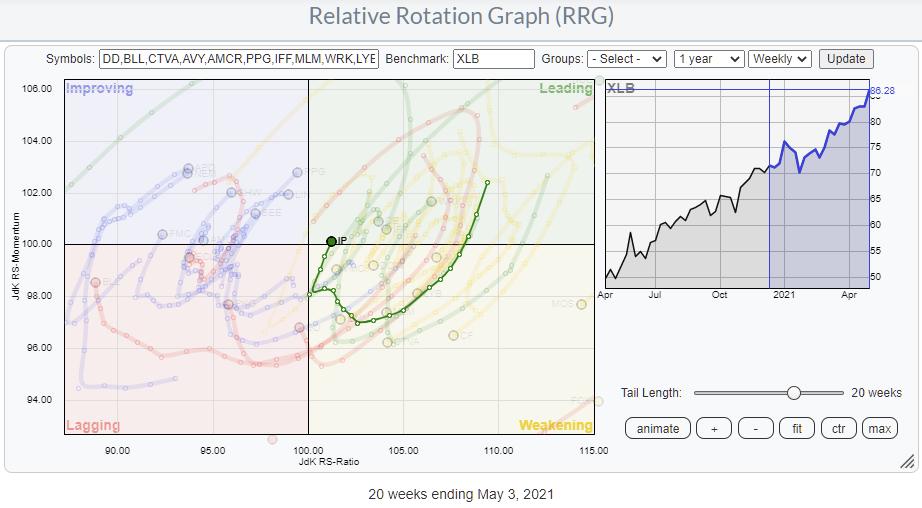
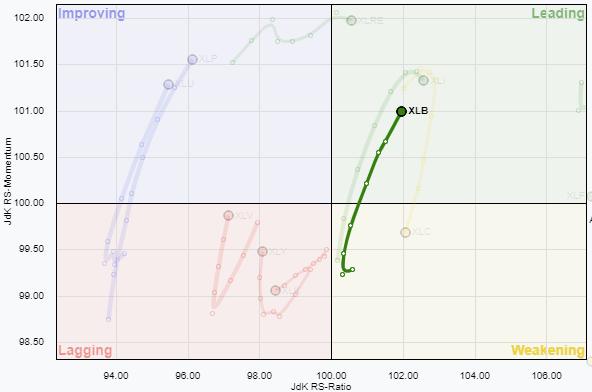
 The Relative Rotation Graph for sectors shows XLB, the Materials sector, powering into the leading quadrant.
The RRG at the top of the article shows the rotations of the individual stocks in the Industrials sector, with the tail for IP highlighted. After entering the leading quadrant in October, IP traveled through the leading quadrant and into weakening in January and is now rotating back into the leading quadrant to start the next leg in its relative uptrend.
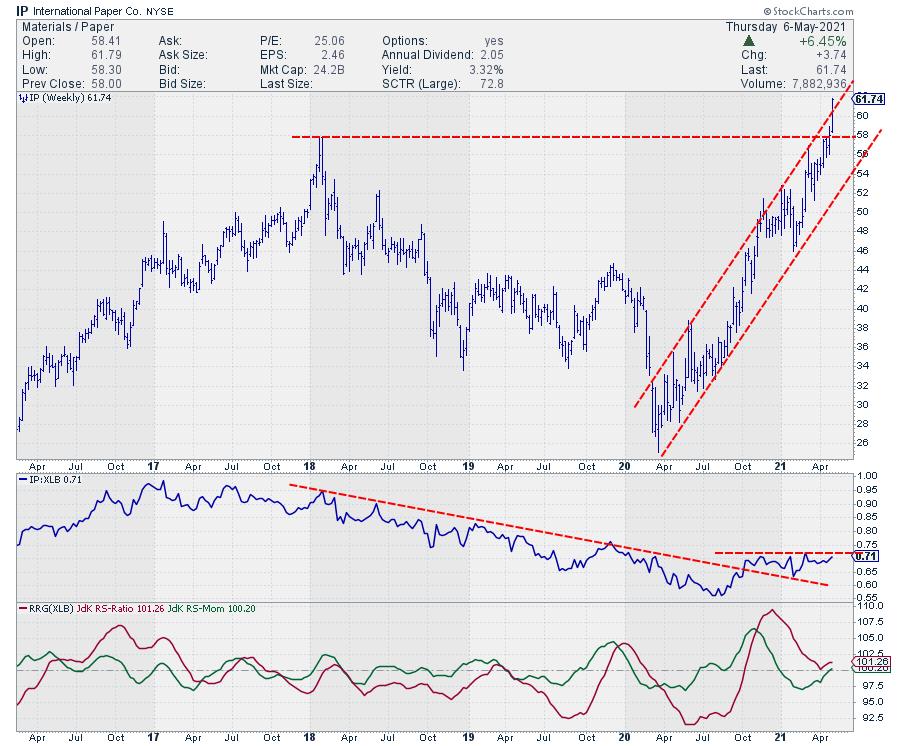
The current price action on the weekly chart supports the further relative improvement of IP vs. XLB and, thus, also vs. SPY.
The stock price has already convincingly broken the horizontal overhead resistance level around $58 and looks to be breaking out of the already rising channel. The chart above is a weekly chart, and the last bar was not complete as of the time of writing this (Thursday after the close).
The turnaround in relative strength is clearly visible in the RS-Line, which has broken the falling resistance line. After a short period of consolidation, now seems to be ready to break the recently-formed horizontal resistance level. This makes IP a good candidate for inclusion in the RRG Long-Short basket.
RRG Long-Short Baskets
The stocks currently in the Long basket are shown on the RRG below.
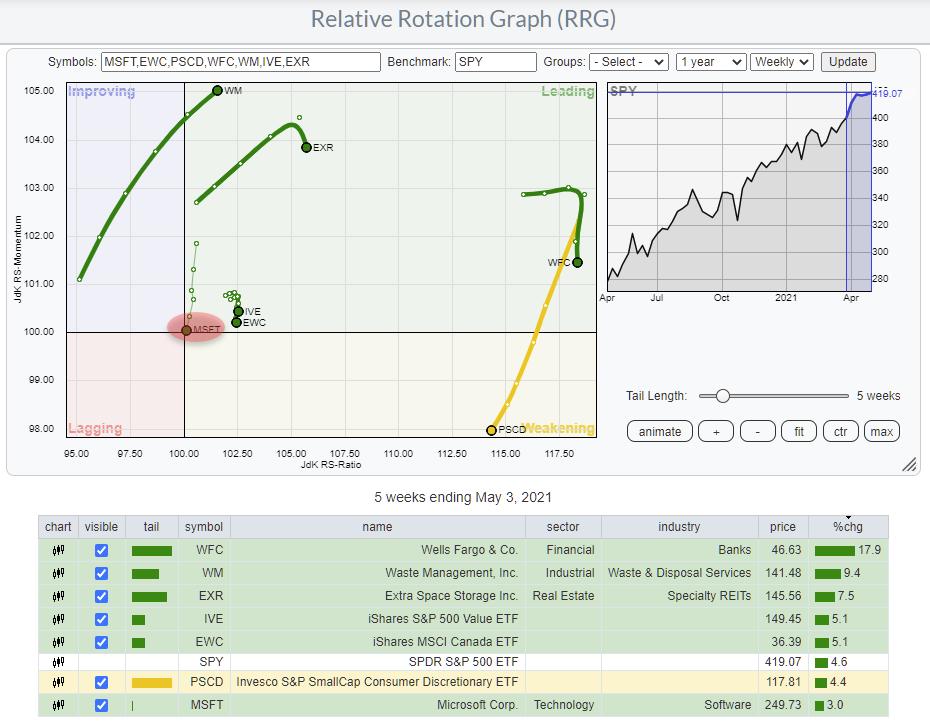
The performances are, in general, nicely holding up and contributing to the bottom line. PSCD is now slightly below the benchmark, but at a very high RS-Ratio reading and within the boundaries of a very steep trend channel on the price chart. So far, this rotation from leading into weakening is judged as a pause within the move higher, and a rotation back to leading is expected in the coming weeks.
The tail on MSFT is a bit more worrisome. After crossing over into the leading quadrant, MSFT almost immediately rolled over and started to head lower. The RS-Line did not manage to really turn around and now seems to be on the verge of continuing its slide, dragging both RRG-Lines lower and towards the 100-level, threatening to move into the lagging quadrant.
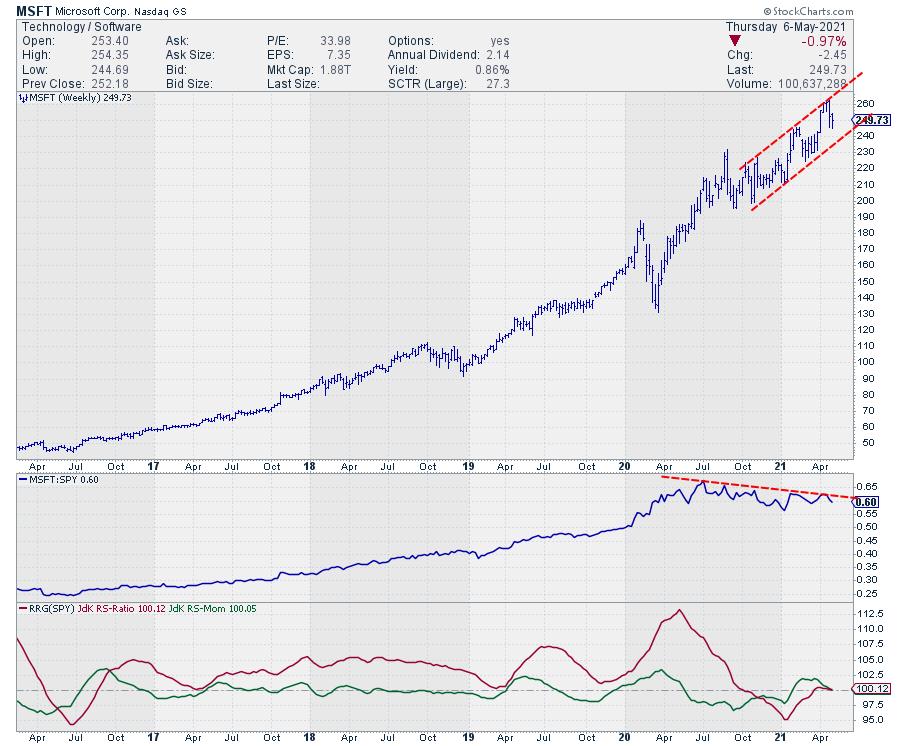
This relative weakness is especially driving the removal of MSFT from the Long basket, to be replaced by IP. This brings the current composition for the baskets to this:
LONG : EWC, EXR, IP, IVE, PSCD, WFC, WM
SHORT : ETR,COST,XLY,AWK,PG,IVW,MTD
If you click the link, it will open the RRG with these stocks, so you can track their rotations vs. SPY.
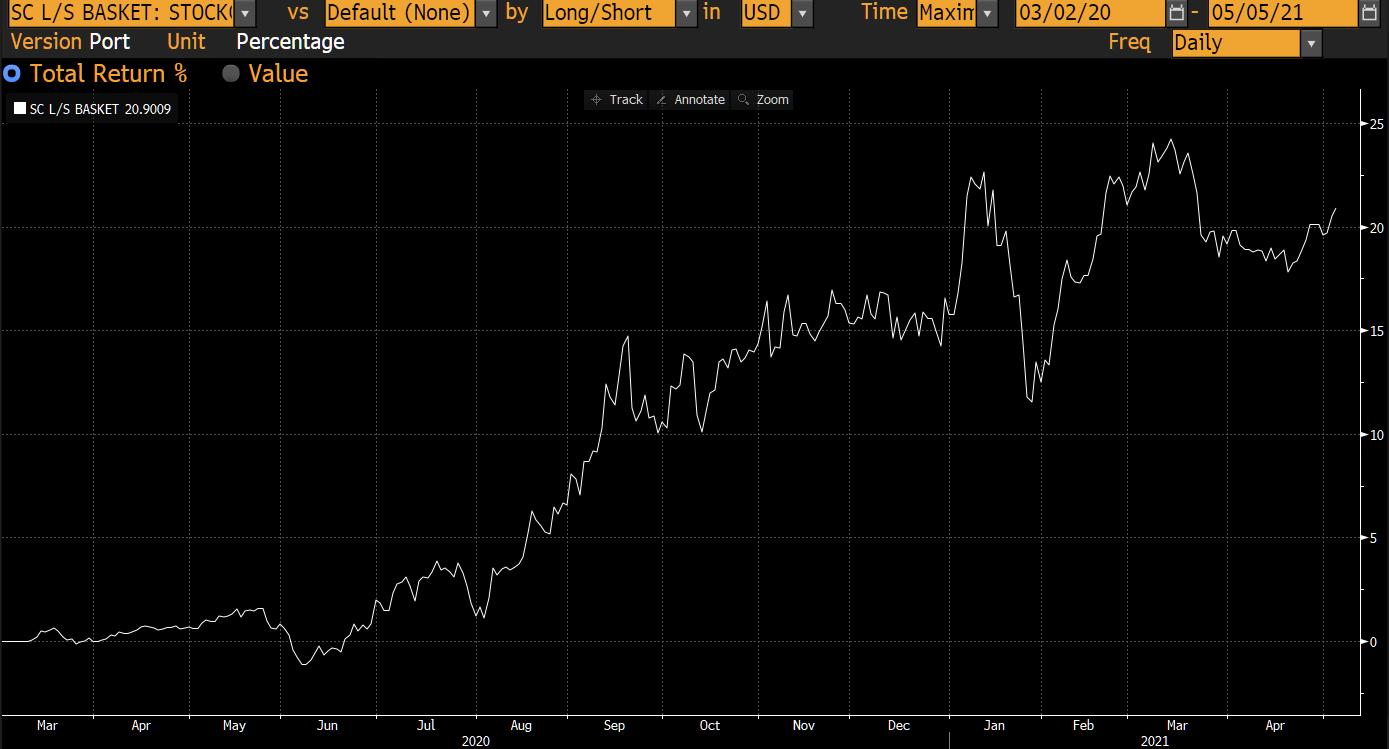
Performance
The last time I wrote on the Long-Short baskets, I forgot to add an updated performance graph. So here it is updated through to Wednesday 5/5.
#StaySafe, --Julius
Julius de Kempenaer
Senior Technical Analyst, StockCharts.com
Creator, Relative Rotation Graphs
Founder, RRG Research
Host of: Sector Spotlight
Please find my handles for social media channels under the Bio below.
Feedback, comments or questions are welcome at Juliusdk@stockcharts.com. I cannot promise to respond to each and every message, but I will certainly read them and, where reasonably possible, use the feedback and comments or answer questions.
To discuss RRG with me on S.C.A.N., tag me using the handle Julius_RRG.
RRG, Relative Rotation Graphs, JdK RS-Ratio, and JdK RS-Momentum are registered trademarks of RRG Research.


