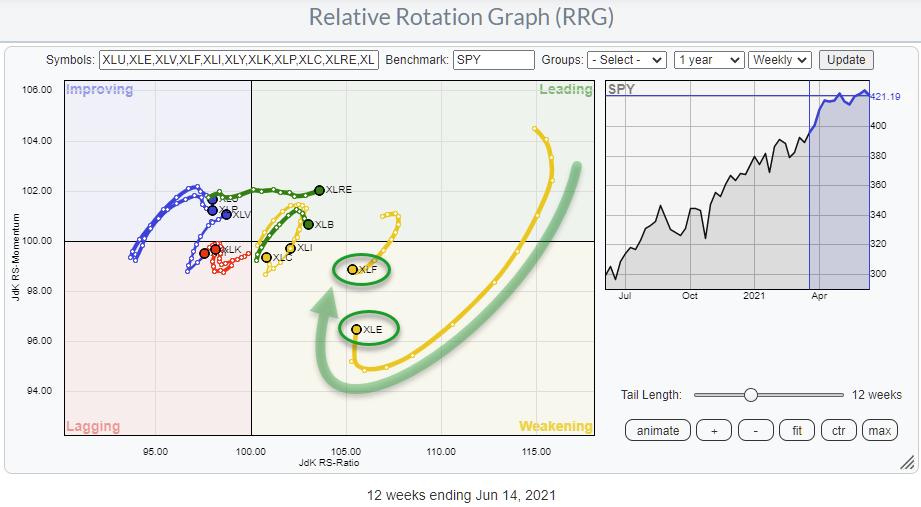
The Relative Rotation Graph for US sectors shows interesting rotations on the tails of the Financials and the Energy sectors. These two sectors are inside the weakening quadrant on the RRG, but ranking highest on the JdK RS-Ratio scale.
Both sectors completed a first stint through the leading quadrant, entering from improving. They followed each other into the weakening quadrant, where they are now starting to pick up relative momentum again.
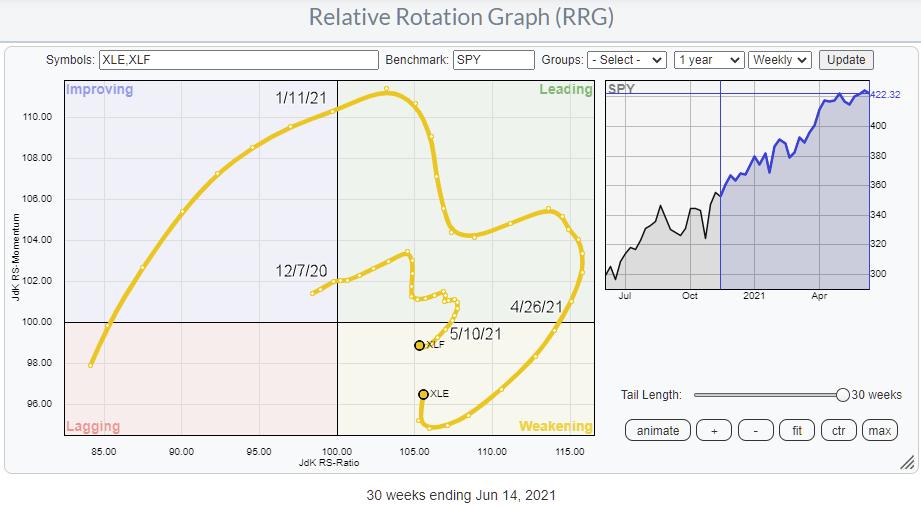
Financials entered the leading quadrant from improving already on 7 December 2020. Energy followed on 11 January 2021. Energy made a wider rotation, more volatile, more alpha, and crossed into weakening on 26 April. Financials remained closer to the benchmark and crossed over into weakening on 10 May.
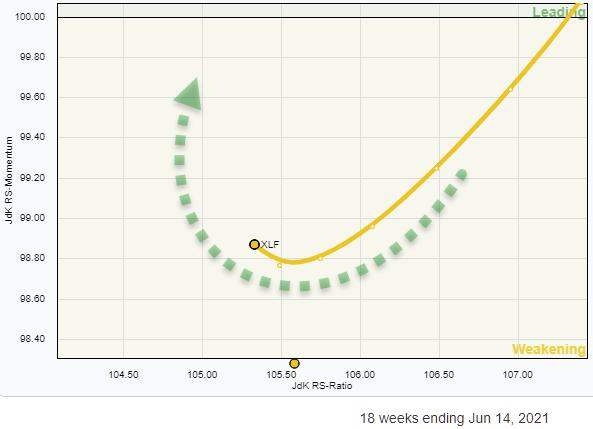 Zooming in on the recent rotations of these tails shows that XLE has already made the turn back into a 0-90 RRG-Heading and is now pointing towards the leading quadrant again. The strongly zoomed-in image of the XLF tail shows that RRG-Velocity started to decrease a few weeks ago. This makes it easier for a tail to curl up, and the sector has started to gain on the JdK RS-Momentum scale already.
When this improvement continues, a rotation further upward inside weakening, and eventually towards and into leading, is very well possible.
Financials
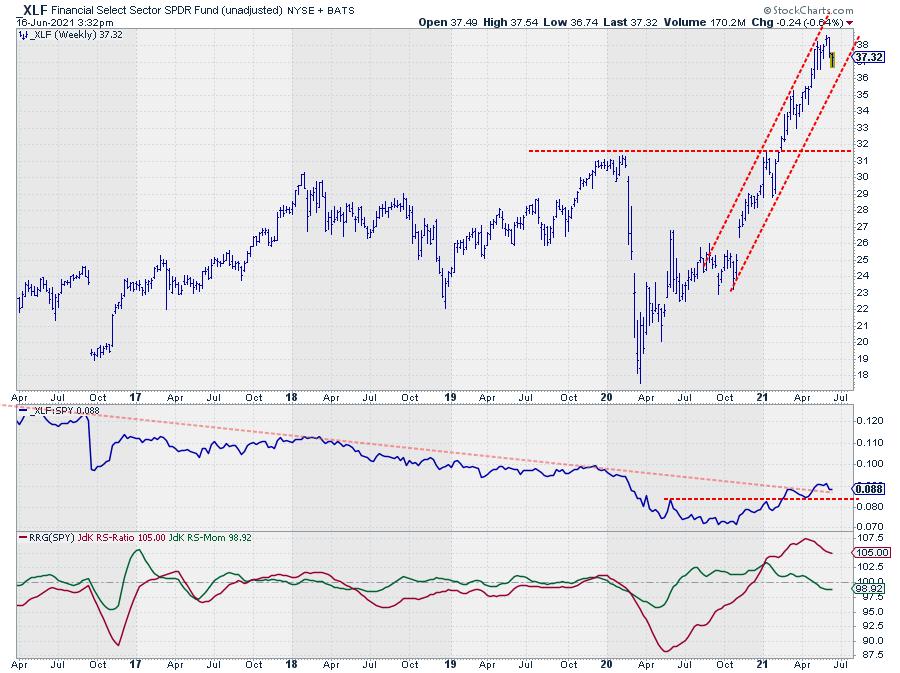
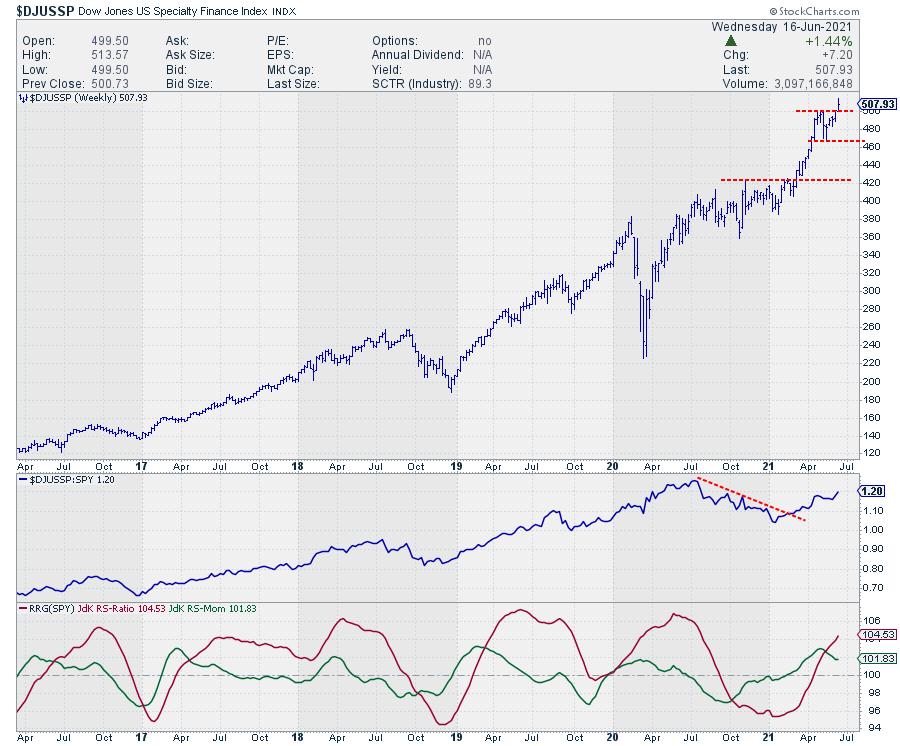
XLF is still trading nicely within the boundaries of its steep rising channel. Thus, the rhythm of higher highs and higher lows is certainly still intact for this sector. From a relative perspective, it looks as if a multi-year downtrend is in the process of reversing. A new series of higher highs and higher lows is emerging on the RS-line and, at the moment, is in the process of breaking the down-sloping resistance line.
The RRG-Lines picked up that first improvement during the second half of 2020. Recently, the improvement in RS caused the RRG-Lines to slow down and push the tail into the weakening quadrant, but, as seen on the RRG above, it has now slowly started to curl back up, lining up for a renewed rotation towards the leading quadrant, picking up or continuing its relative uptrend.
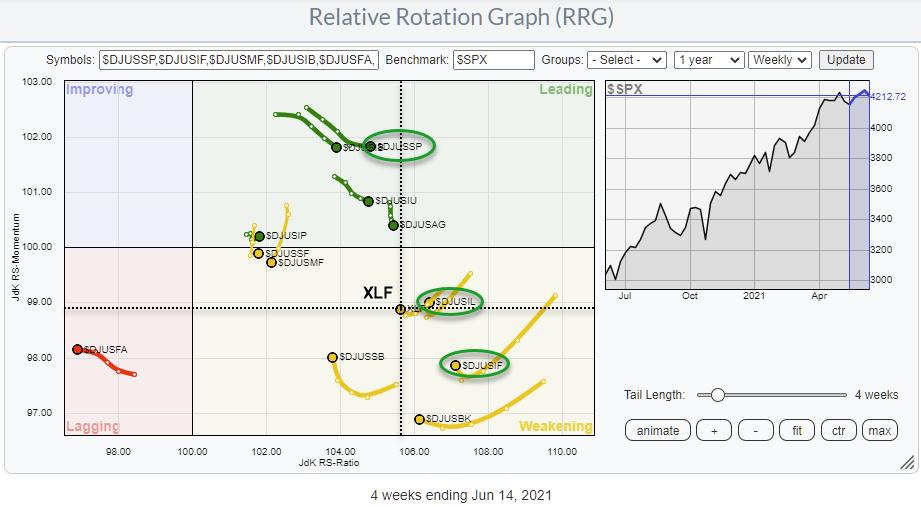
Bringing up the RRG for the industries inside the Financials sector shows that they are predominantly located to the right of the benchmark (SPY), which is to be expected given the current strength of the sector. XLF itself is also visible on this RRG. The dotted lines represent the axes when the RRG would be plotted against XLF as the benchmark.
 On this RRG, I think three industries are worth a closer look. Plotted on the small RRG to the left against XLF, they are $DJUSIF (Full Line Insurance), inside the weakening quadrant vs. XLF and curling upward; $DJUSIL (Life Insurance index), very close to XLK and rotated through weakening and back into leading vs. XLF; and $DJUSSP (Specialty Finance), located inside improving vs. XLF and heading towards the leading quadrant, moving higher on the RS-Ratio scale again after a recent loss of some momentum.
Specialty Finance
Out of these three, I prefer Specialty Finance. In combination with the upward break on the price chart, the long tail makes it an industry to keep an eye on and possibly dive into to select some interesting individual stocks.
Energy
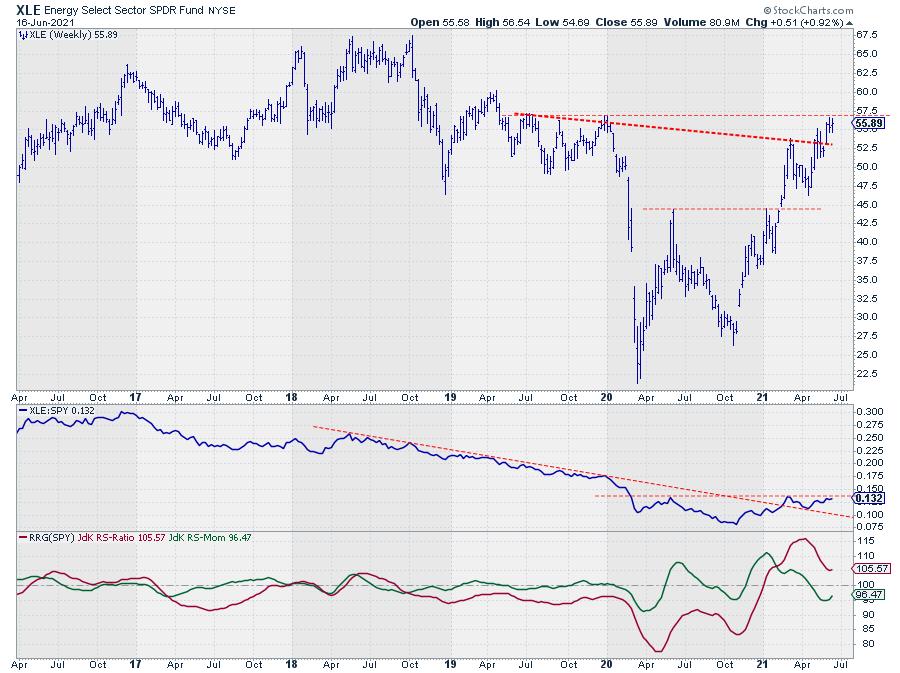
The energy sector subsequently passed some serious resistance levels since bottoming out in Q1-2020. After passing the resistance just below $45, the move started to get more traction. The chart above is the chart from my list that I always use in Sector Spotlight, which I update from time to time. As you can see, we are now running into the next resistance level, around $57.50, while relative strength needs to take out its previous highs (2x).
The RRG lines seem to be anticipating such a break and a continuation of the relative move higher.
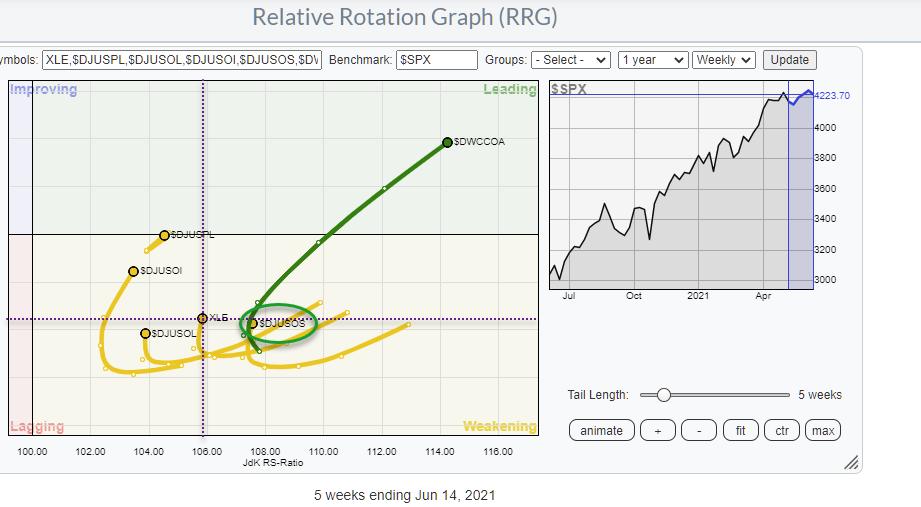
The RRG above shows the rotation of the various industries within the energy sector against the S&P 500 index. Clearly, the tail for $DWCCOA (Coal) stands out. And the chart looks very nice as it has just come out of a long base. Nevertheless, I will ignore this industry for this article, as it holds no stocks that are also a member of the S&P 500.
The RRG above again shows the axes for the comparison vs. XLE as the benchmark, and, as you can see, ALL tails are traveling at an RRG-Heading between 0-90 degrees. That is pretty strong.
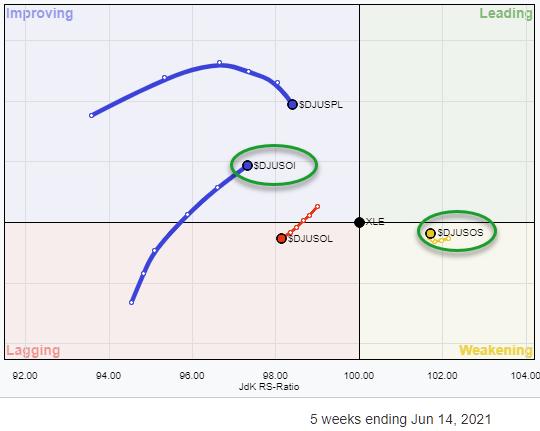
Taking away the Coal industry and plotting the groups against XLE gives the RRG to the right. What becomes immediately clear is that Integrated Oil & Gas ($DJUSOL) is the weakest group in the sector and can better be avoided.
Exploration and Production is inside the weakening quadrant and turning up, but at a very short tail. An inspection of the chart learns that this group is now running into overhead resistance around 650.
Oil Equipment & Services, on the other hand, shows a rather long tail and is traveling at a strong RRG-Heading inside the improving quadrant.
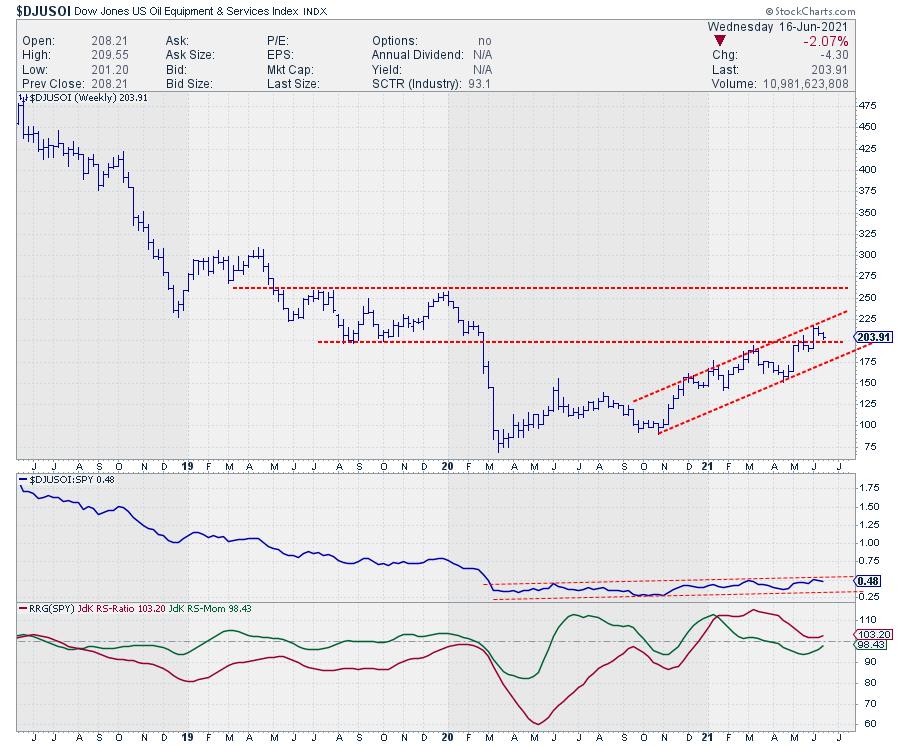
On the price chart, $DJUSOI has just taken out horizontal resistance, which is now acting as support while the group is still inside the rising channel.
Relative strength is still in a long, 18-month trading range, but pushing against the upper boundary while the RRG-Lines have already turned upward. A push through that upper boundary in relative strength will very likely accelerate the rise in the RRG-Lines and push this group further into the leading quadrant, against both the S&P 500 and the Energy sector.
#StaySafe, --Julius
Julius de Kempenaer
Senior Technical Analyst, StockCharts.com
Creator, Relative Rotation Graphs
Founder, RRG Research
Host of: Sector Spotlight
Please find my handles for social media channels under the Bio below.
Feedback, comments or questions are welcome at Juliusdk@stockcharts.com. I cannot promise to respond to each and every message, but I will certainly read them and, where reasonably possible, use the feedback and comments or answer questions.
To discuss RRG with me on S.C.A.N., tag me using the handle Julius_RRG.
RRG, Relative Rotation Graphs, JdK RS-Ratio, and JdK RS-Momentum are registered trademarks of RRG Research.


