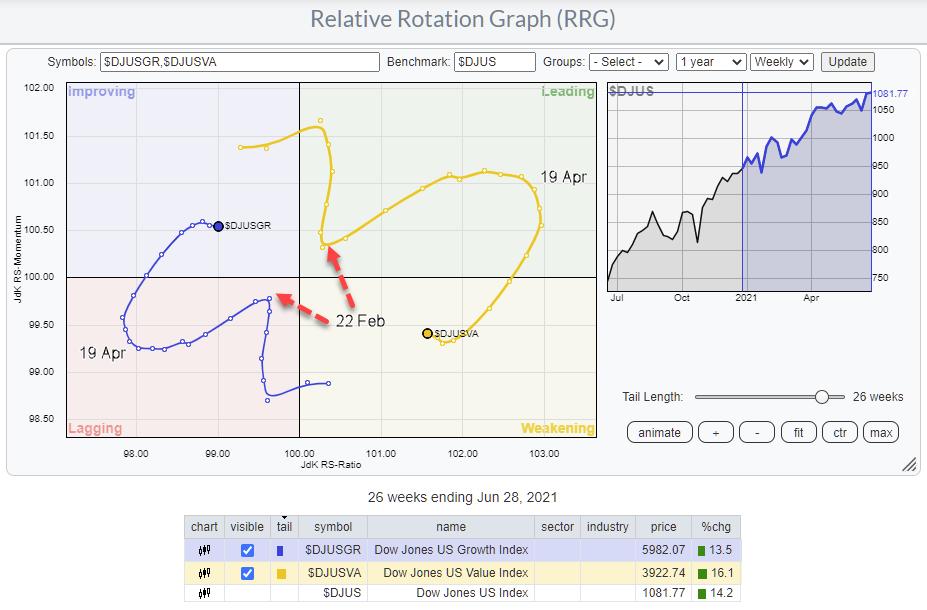
The Relative Rotation Graph above shows growth vs. value stocks rotations over the last six months (two quarters). After the initial cross into the leading/lagging quadrant, the relationship almost immediately started to move back in favor of Growth. Until both tails hooked in the week of 22 Feb, from that point onward, Value and Growth started moving in opposite directions aggressively, resulting in a strong stint for Value stocks.
Around the week of 19 April, the tails started rotating again. Value started to roll over inside the leading quadrant and moved into the weakening quadrant a few weeks later. Growth started curling up and pushed into the improving quadrant at the same time.
Very recently, Value started to crawl back up again inside the weakening quadrant, while Growth started to roll-over inside, improving. We know that such rotations at the same side of the RRG (Leading-Weakening-Leading or Lagging-Improving-Lagging) are usually the stronger and more reliable rotations, as they represent a new leg in an already established (relative) up- or down-trend.,
Last week, I had a call with an institutional fund manager, where we discussed the Growth Value rotation. In this conversation, the use of RPG and RPV came up. These are two ETFs that can be used to "play" the Growth Value rotation. The big difference is that they represent "Pure" growth and value, whereas there can be some debate on the classification of some stocks as growth or value. In some classifications/Indexes, some stocks are classified as both Growth AND Value; with the "Pure" versions that is not the case.
To check whether these ETFs are moving in line with the Dow Indexes that I usually use to track this rotation, I added them to the RRG.
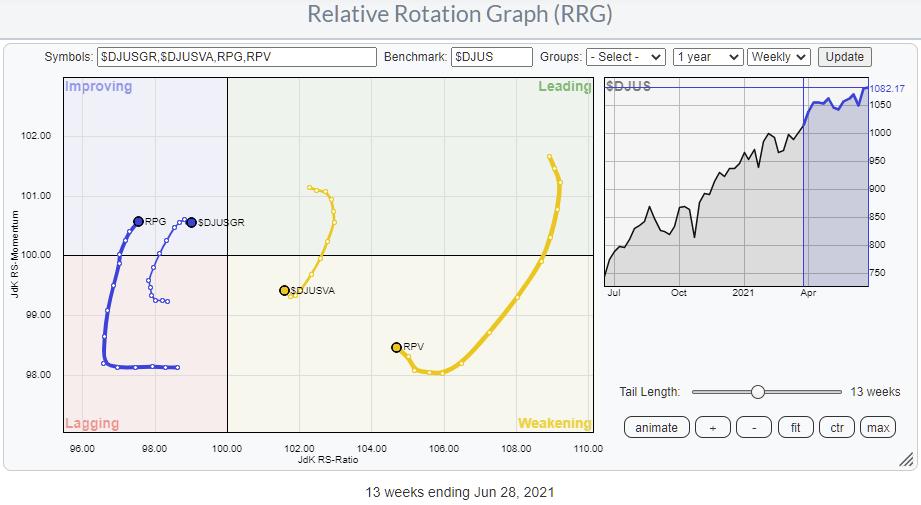
As you can see, they do a decent job (as expected). The positions are not entirely identical, but that is not needed. The ETFs are a means to get the desired exposure. The exact rotational pattern is of less interest.
The next step is to look at the daily chart to see how the daily tails are positioned against the weekly versions.
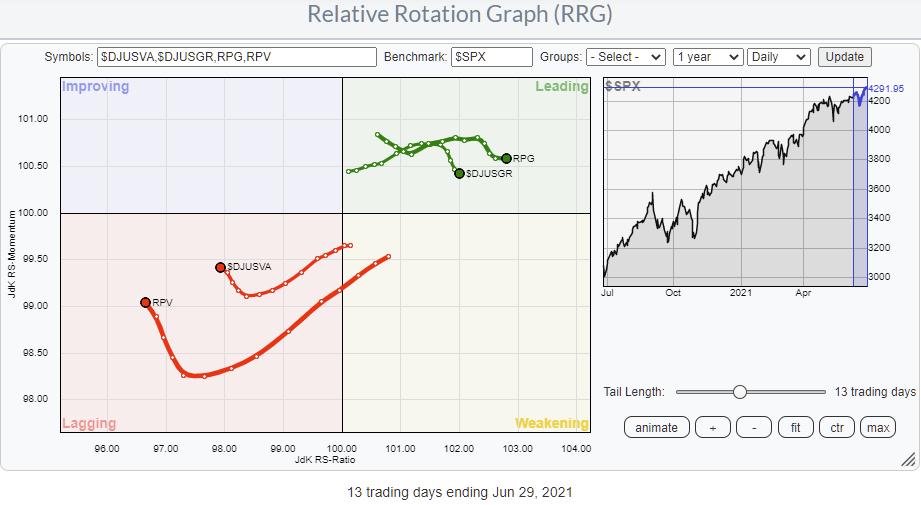
The recent improvement of Growth vs. Value is clearly visible, with Growth inside leading and Value inside lagging. However, Growth is starting to roll over while Value has started to curl back up.
So the question now is: Will the daily rotation will roll over and bring back the strength of Value with enough strength to pull the weekly tails around, re-igniting the outperformance of Value over Growth?
OR...
Will Growth continue higher on the JdK RS-Ratio scale (and Value lower) and eventually drag the weekly tail for Growth (in)to leading and Value (in)to Lagging?
It is not very clear for me at the moment. As the weekly tail represents the longer-term and, thus, stronger trend, that would imply that Value is starting a new up-leg and will keep the upper hand in coming weeks. The one thing that holds me back from calling for a definite direction for this rotation is the outright comparison.
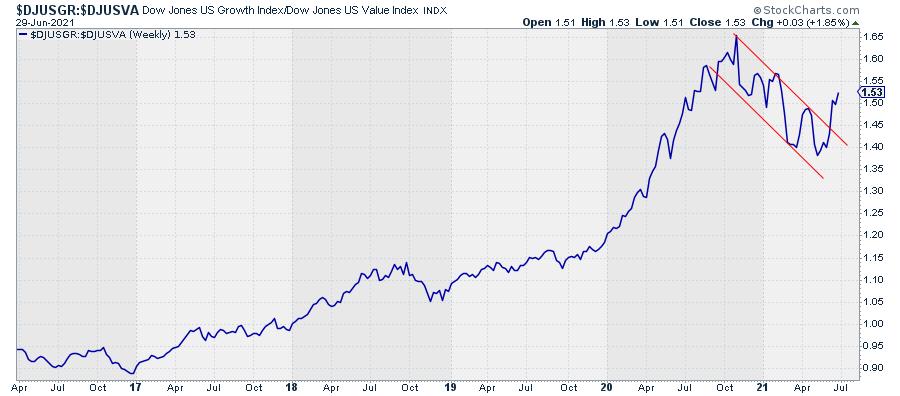
This relative chart shows a pretty clear break from the downtrend that started from the peak in October last year - i.e., favoring Growth.
For more clarity and a revival of the uptrend in Growth/Value, this ratio should now, rapidly, take out its recent high near 1.65. The longer that takes and/or the more difficult such a break will be (IF we see it at all), the more sustainable and more meaningful the rotation to Value will be.
#StaySafe, --Julius
Julius de Kempenaer
Senior Technical Analyst, StockCharts.com
Creator, Relative Rotation Graphs
Founder, RRG Research
Host of: Sector Spotlight
Please find my handles for social media channels under the Bio below.
Feedback, comments or questions are welcome at Juliusdk@stockcharts.com. I cannot promise to respond to each and every message, but I will certainly read them and, where reasonably possible, use the feedback and comments or answer questions.
To discuss RRG with me on S.C.A.N., tag me using the handle Julius_RRG.
RRG, Relative Rotation Graphs, JdK RS-Ratio, and JdK RS-Momentum are registered trademarks of RRG Research.


