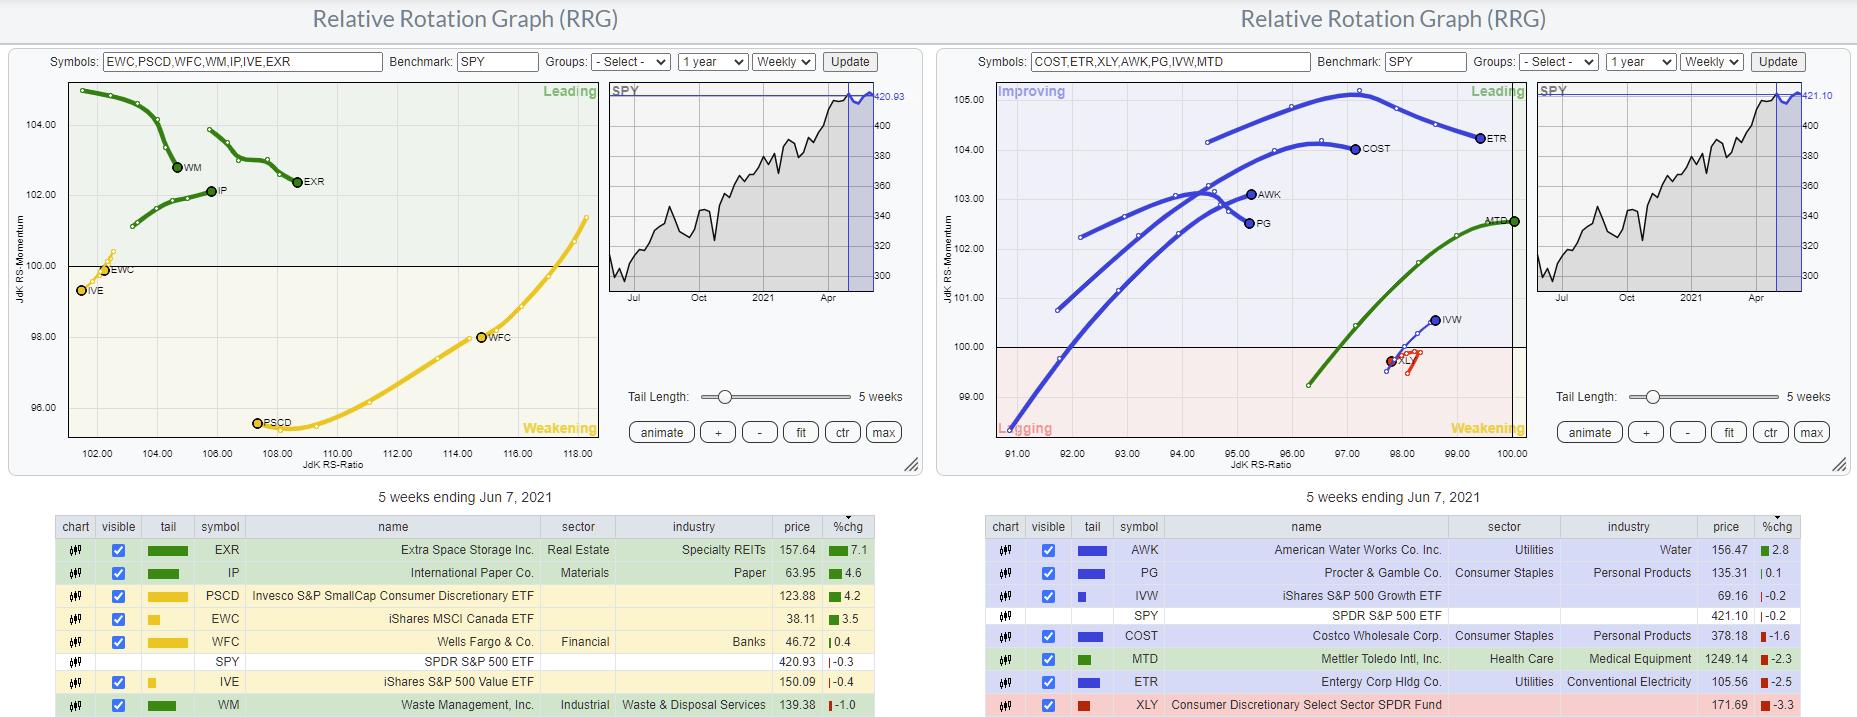
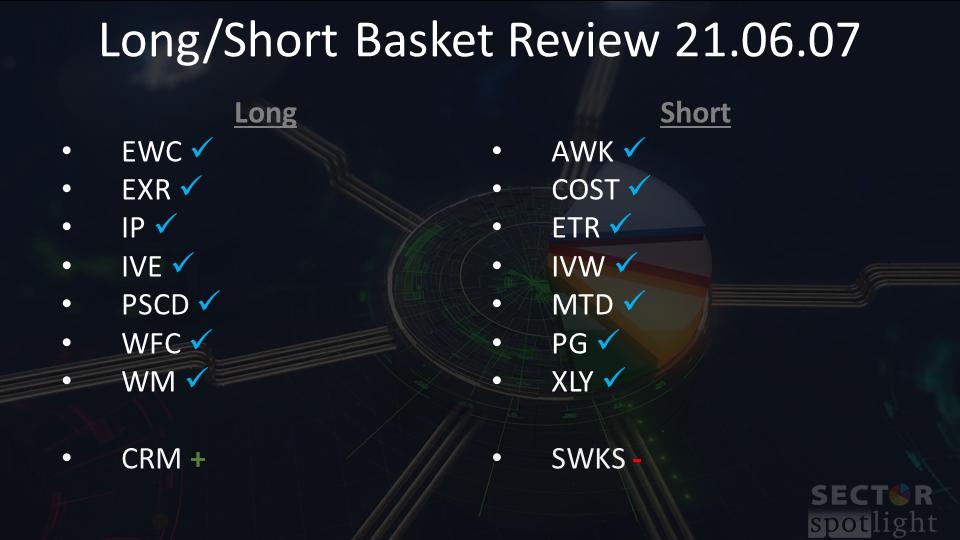
In today's episode of Sector Spotlight, I did a full review of all stocks that we are monitoring in the RRG L/S baskets. Both baskets (Long and Short) with the stocks on watch are shown in the RRGs above; the members of the Long basket are on the left and the short basket on the right. At the end of the show, I introduced two new additions. Salesforce (CRM) on the long side and Skyworks Solutions (SWKS) on the short side. In this article, I will provide my rationale for these additions to the baskets.
First of all, both stocks are in the Technology sector, which is one of the weaker sectors. In the Sector Spotlight seasonality segment for June and a recent presentation in Your Daily Five, I highlighted that the seasonal expectations for the Tech sector going into June were mixed.
The current rotation on the RRG, as well as the seasonal expectations, are weak. However, the average performance vs. SPY in June over the last 20 years is flat. One conclusion could be (and maybe should be) that XLK will be dragging SPY lower in June.
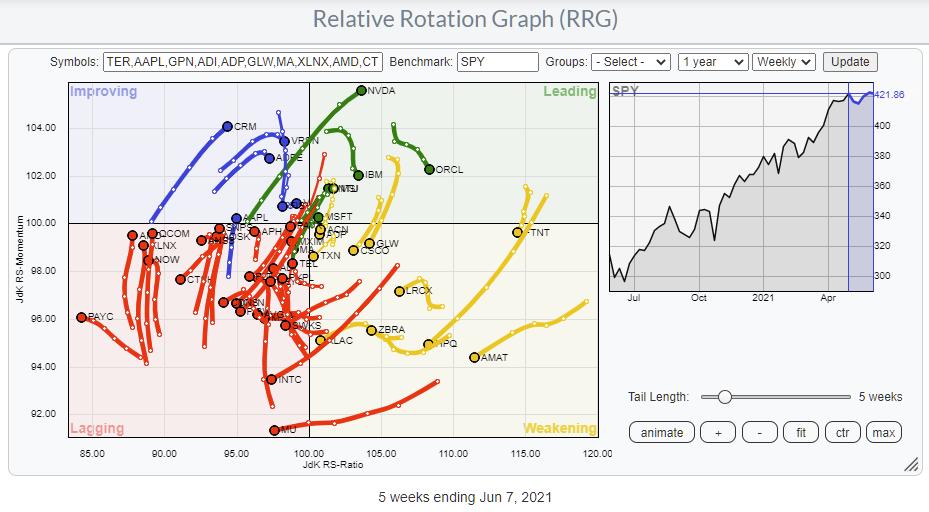
Nevertheless, when you dig a bit deeper and show all XLK members on a Relative Rotation Graph against SPY, it is only slightly tilted to the (lower) left, and there are definitely also a few more interesting tails for long positions visible.
Checking Out The Industries
To get a better handle on how this universe is spread in terms of relative strength, I charted the RRG for the industries inside the Technology sector.
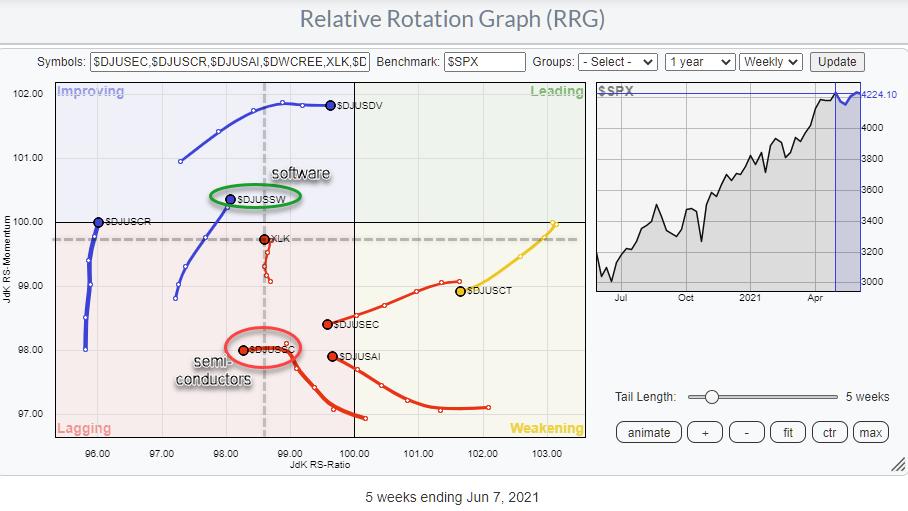
Most of the tails on these industries are to the left of the benchmark ($SPX), indicating a relative downtrend, which is to be expected when the sector index (XLK) itself is moving to the left of $SPX and inside the lagging quadrant. Please note that the dashed lines indicate the center of the RRG when XLK would be used as the benchmark.
The first tail that looks interesting is $DJUSDV, Computer Services, but when I explored the chart, I noticed that the relative strength line is still very weak, and the tail on the RRG has already started to flatten after its initial rotation through the improving quadrant.
The next tail, on $DJUSSW, software, seems to be offering more opportunities. There is no shortage of weak tails and negative RRG-Headings on this chart. Studying the individual price charts, in combination with the position of the talks on the RRG, I came to $DJUSSC, semiconductors, as being the one with the most downside potential in relative terms.
Software
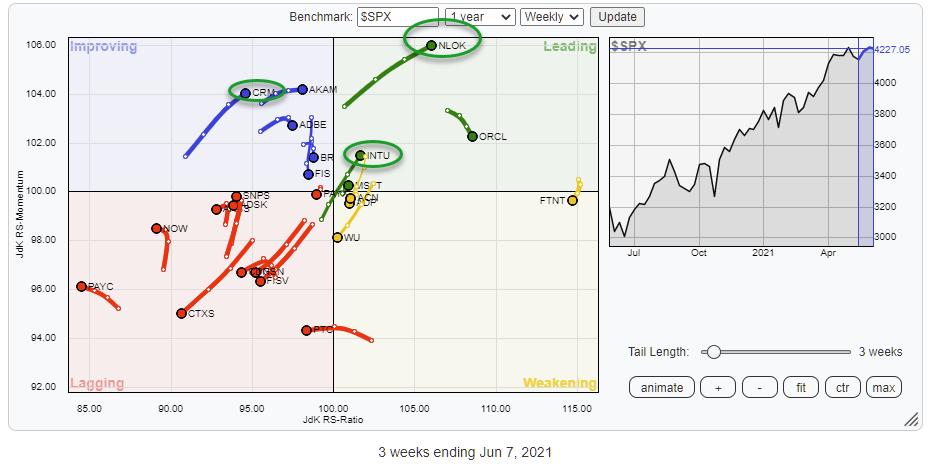
Plotting the members of the Software index on a Relative Rotation Graph against $SPX gives the image above. Despite the clear bias towards the lagging quadrant, a few tails are certainly worth further inspection.
First of all, NLOK (of course) really stands out while powerfully moving into the leading quadrant. The chart sure looks good, but NLOK really rallied very aggressively over the last 5-6 weeks, which means an inherent downside risk is also present. Too much for (my) comfort.
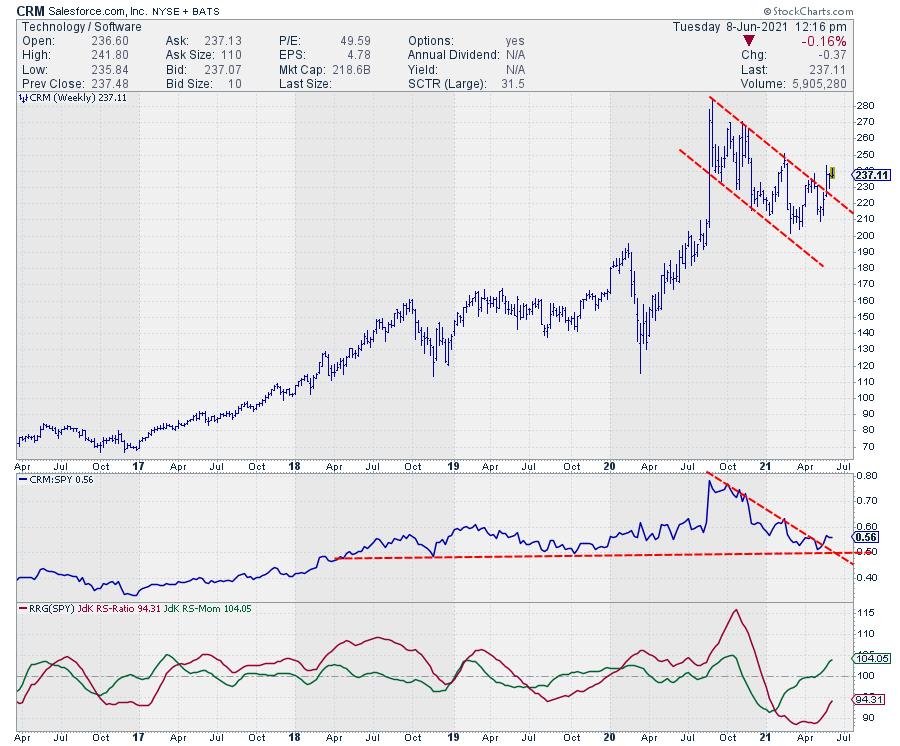
Then there are INTU and CRM. Both are looking strong. For my addition to the Long basket, I went with CRM, as I like the upward break after the downtrend from August last year in combination with the bottoming out of relative strength at horizontal support.
Semiconductors
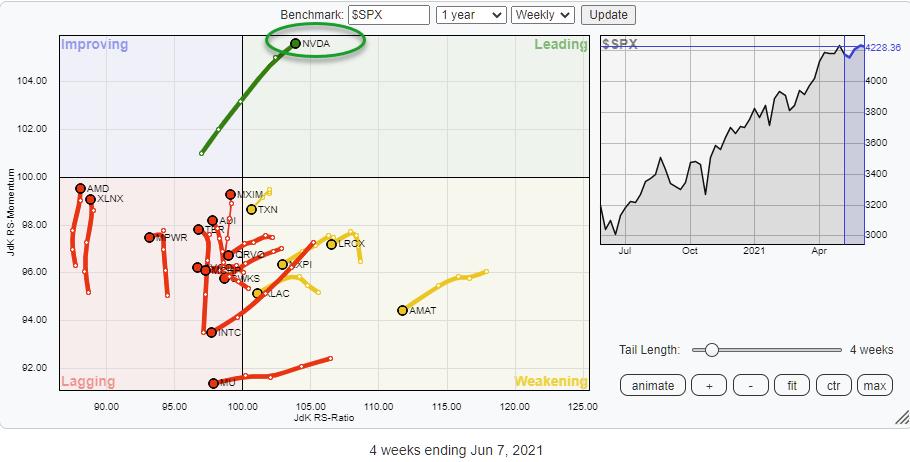
When you plot the members of the semiconductors index on an RRG against $SPX, the tail on NVDA immediately stands out as clearly being the dominant stock in terms of market cap as well as performance. However, despite that strength in NVDA, the $DJUSSC index still is moving further into the lagging quadrant, pointing to more underperformance for the group.
Going over the individual tails and the accompanying charts, I found SWKS as a potential addition to the short basket.
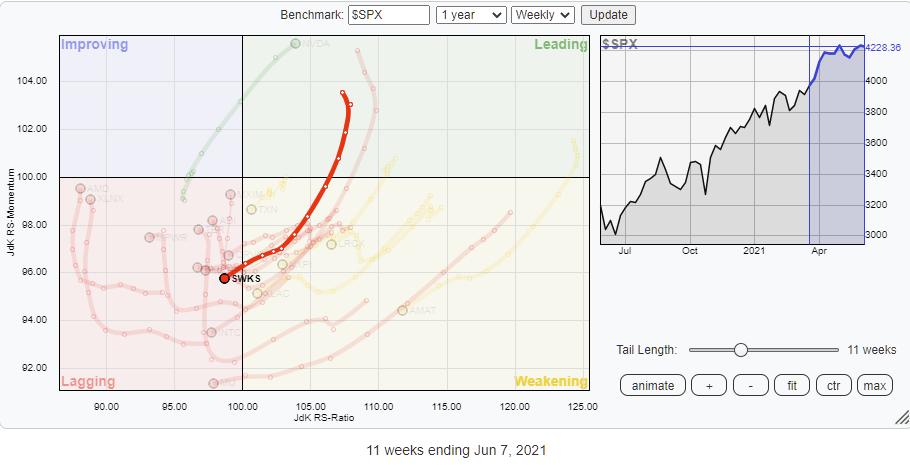
This chart has all the ingredients for a major turnaround in the making. First of all, relative strength has just left a rising channel that started back in 2019. This is now translating in both RRG-Lines moving below 100 and pointing further down.
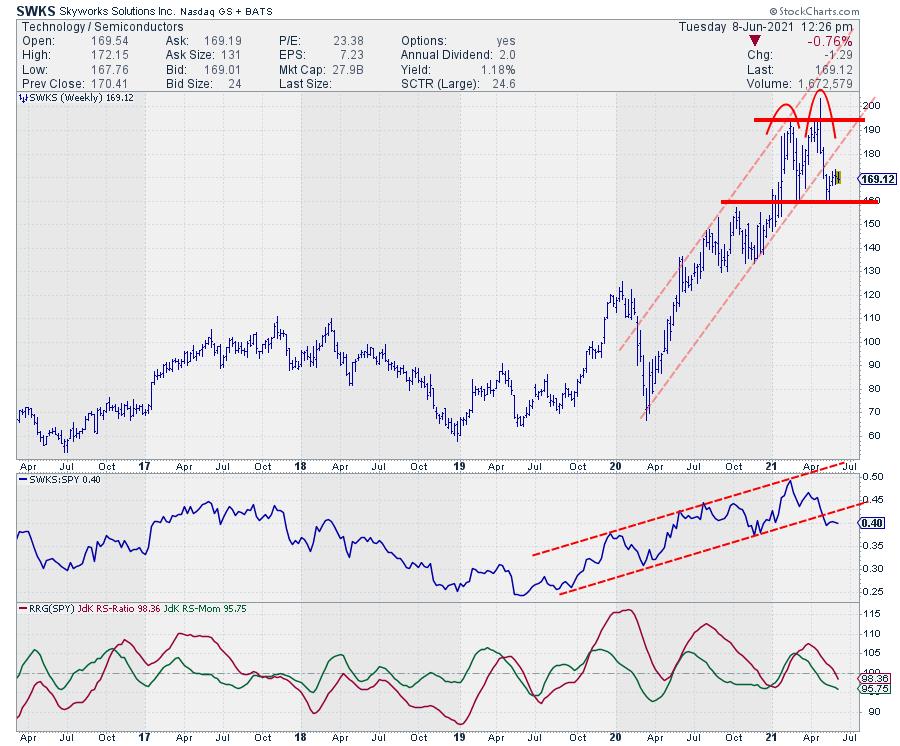
On the price chart, a similar thing happened. Here, the price dropped out of the rising channel that started at the start of 2020 after stalling around $195 on the latest leg up. This means that a large double top formation could now be in the making. The only thing needed now is a break below support at $160. When that happens, SWKS will complete a large double top at the end of a rising channel, while relative strength has already started to head lower. A move to watch out for.
New Basket Compositions
With the new additions, the RRG L/S baskets are now as follows:
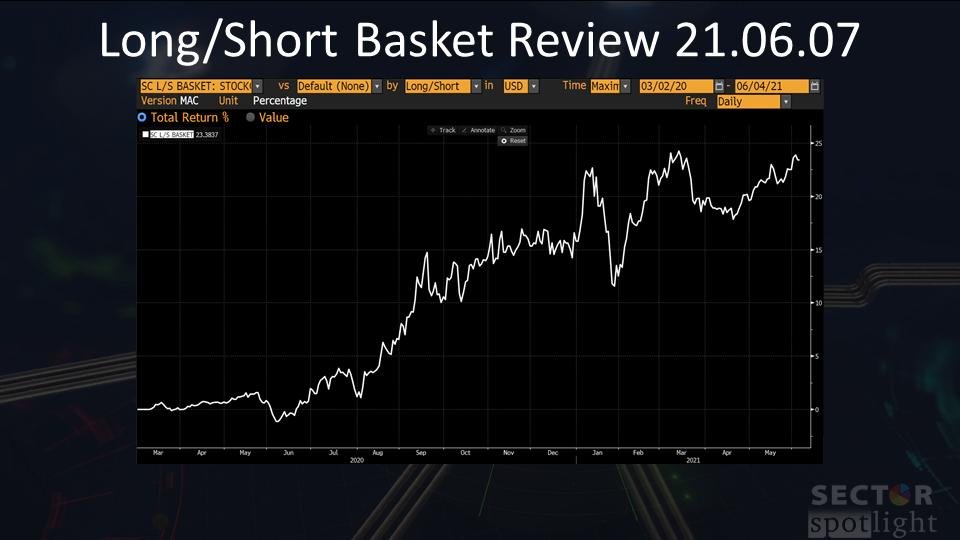
Performance
The performance of the baskets up to 6/7, before adding the new positions, looks like this:
#Stay#Safe, --Julius
Julius de Kempenaer
Senior Technical Analyst, StockCharts.com
Creator, Relative Rotation Graphs
Founder, RRG Research
Host of: Sector Spotlight
Please find my handles for social media channels under the Bio below.
Feedback, comments or questions are welcome at Juliusdk@stockcharts.com. I cannot promise to respond to each and every message, but I will certainly read them and, where reasonably possible, use the feedback and comments or answer questions.
To discuss RRG with me on S.C.A.N., tag me using the handle Julius_RRG.
RRG, Relative Rotation Graphs, JdK RS-Ratio, and JdK RS-Momentum are registered trademarks of RRG Research.


