After the last update of the RRG Baskets we were left with 3 shorts and 3 longs:
LONG : EXR, WM, CRM
SHORT: XLY, SWKS, PSX
LONG
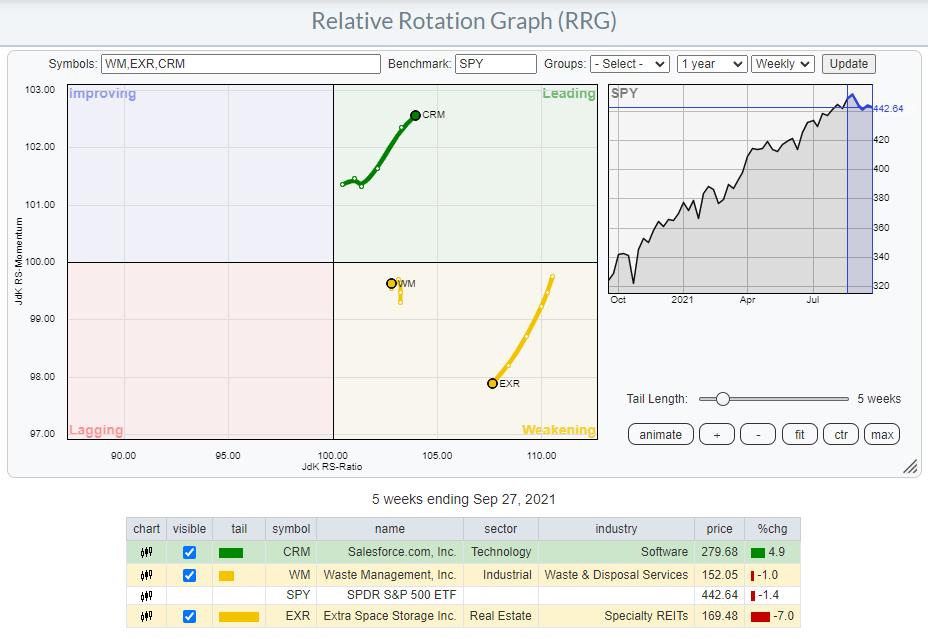
Looking at the recent performance for the members of the long basket we see CRM and WM holding up well vs the S&P 500. EXR, however, underperformed the benchmark significantly over the last five weeks, despite its high reading on the RS-Ratio scale.
EXR
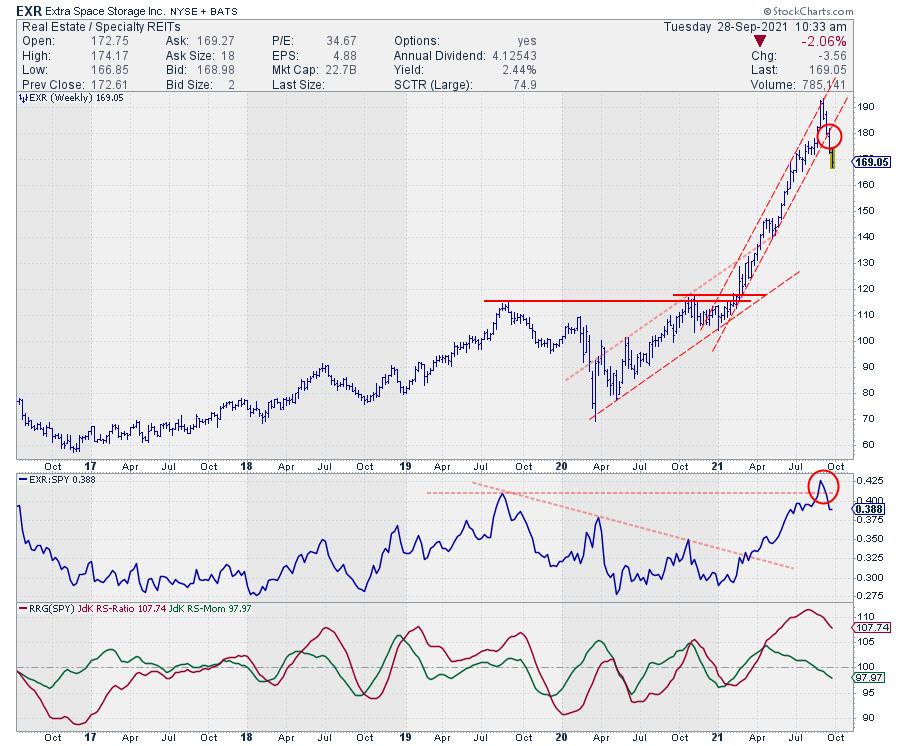
On the price chart, EXR dropped out of its steep rising channel while the RS-Line tried to break higher but failed to hold up and dropped back below that breakout level. That is sending the RRG-Lines lower and positioning the stock inside the weakening quadrant at a negative RRG-Heading.
With little to no support nearby for both price and relative strength, I am removing EXR from the long side.
CRM
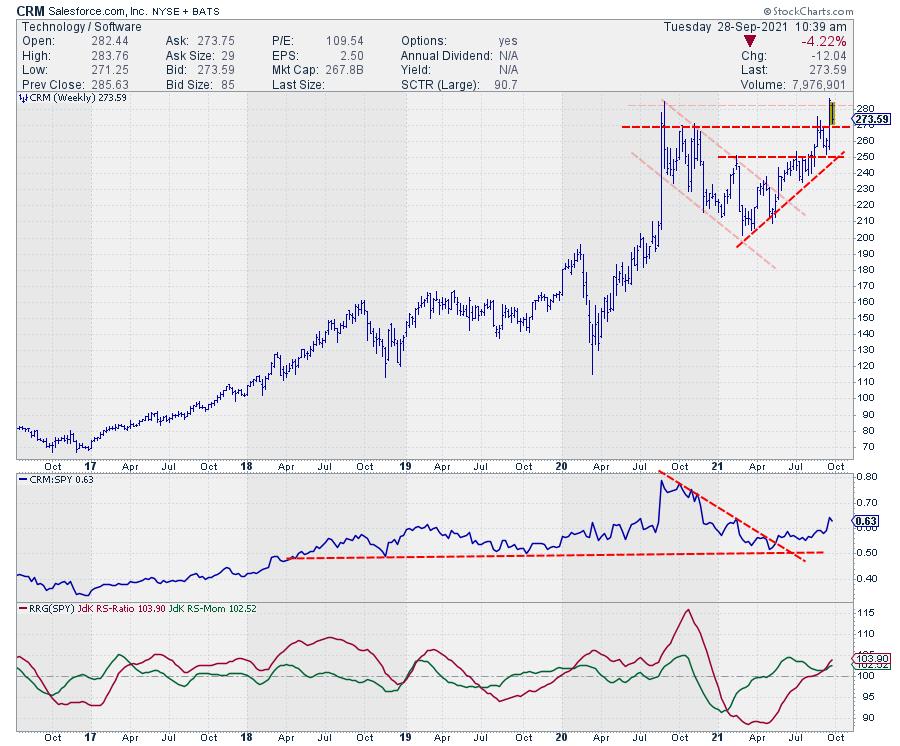
CRM is now pushing against overhead resistance near 280 while relative strength is holding up well. A break beyond 280 will certainly help a further strengthening in relative terms. So far, so good.
WM
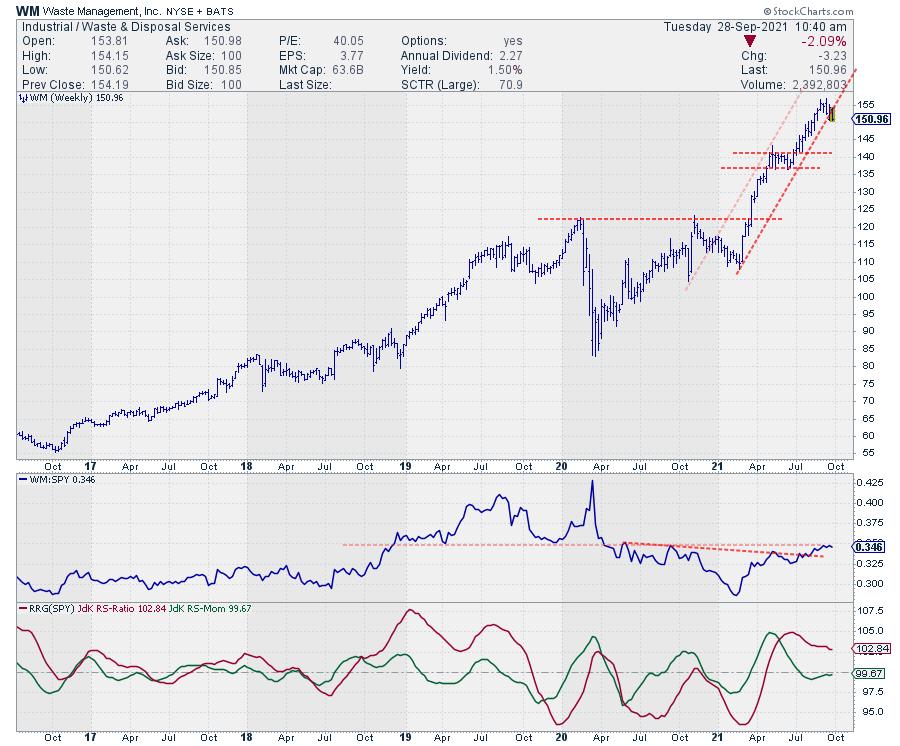
WM is struggling to hold the rising support line that marks the lower boundary of the rising channel. So far relative strength has managed to hold up above its first breakout level and is now trying to break above the next horizontal barrier.
The short tail, inside the weakening quadrant, indicates that the relative uptrend is stable. A push above the horizontal resistance in relative strength would give a bit more comfort but keeping WM for the time being.
Short
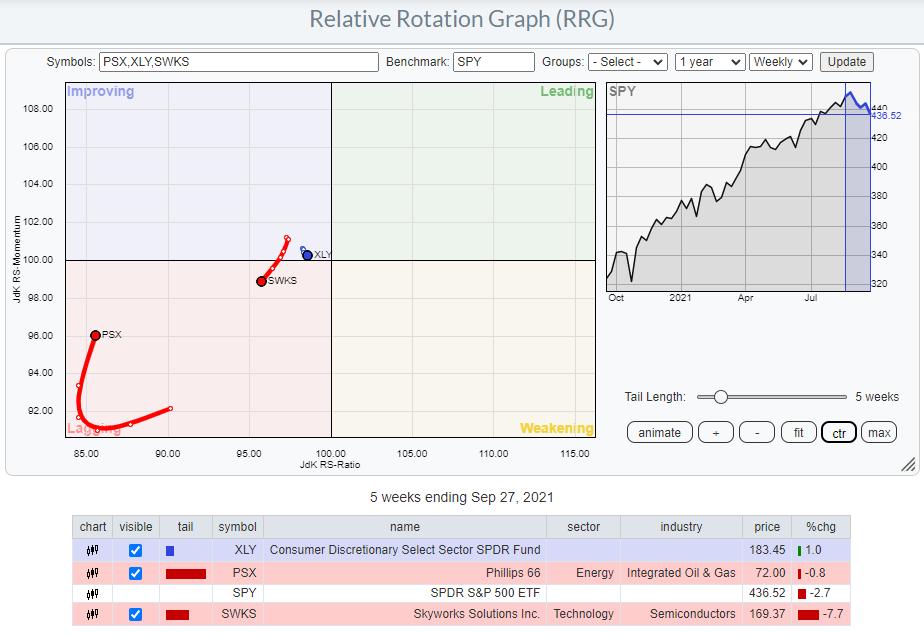
Of the three stocks in the short basket, SWKS moved nicely lower over the last few weeks. PSX did drop in price but not enough to underperform the S&P 500 yet which dropped 2.7% vs -0.8 for PSX.
XLY, the consumer discretionary ETF picked up 1% in the last five weeks but remains at the left of the graph with a very short tail and heading towards the lagging quadrant.
SWKS
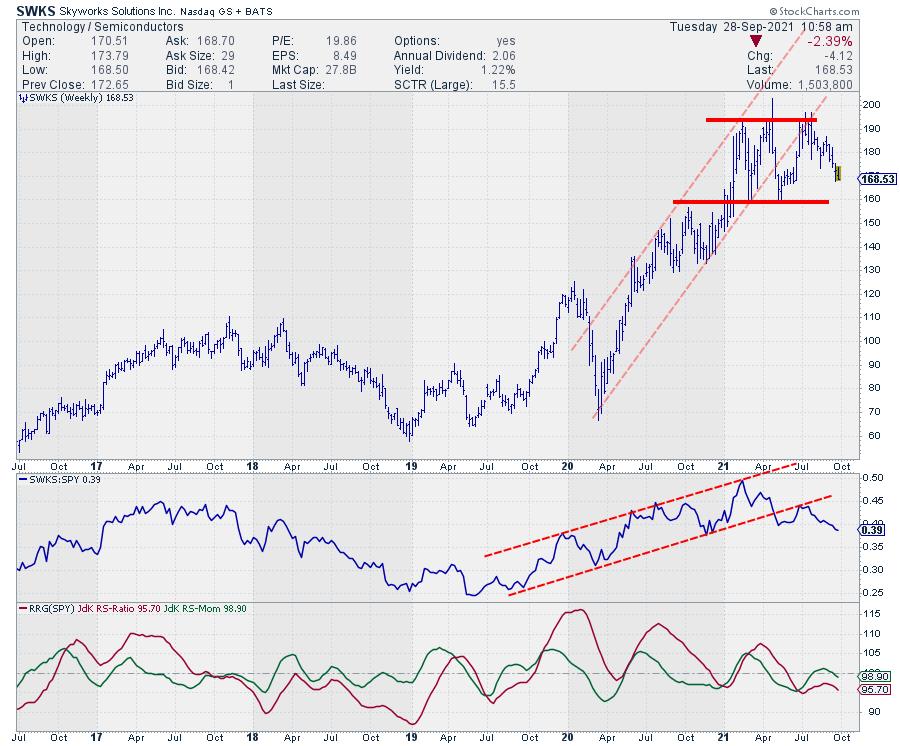
SWKS is falling further after the test of overhead resistance and breaking below rising support while relative strength follows a similar path.
With the rotation from improving back into lagging on the RRG, SWKS remains in the short basket.
PSX
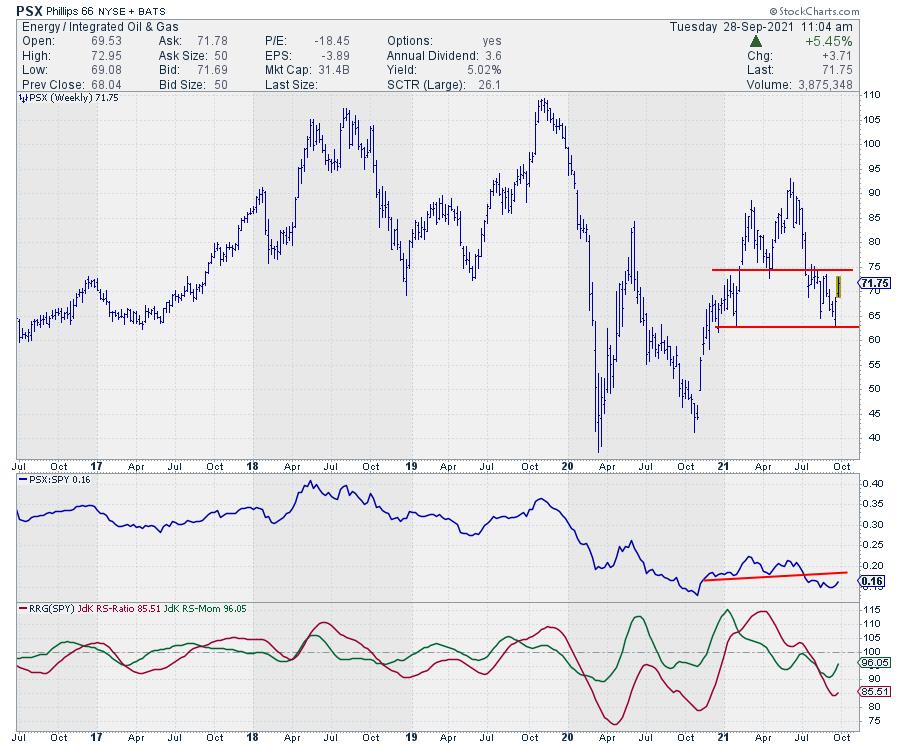
After testing support around 62.50 on the price chart, PSX bounced higher. Around 75 lies the former support area which, very likely, will be hard to break at the moment.
A new lower high below 75 will confirm the weakness in PSX and will very likely also cause more weakness in relative strength, bringing PSX back as an underperformed in coming weeks.
XLY
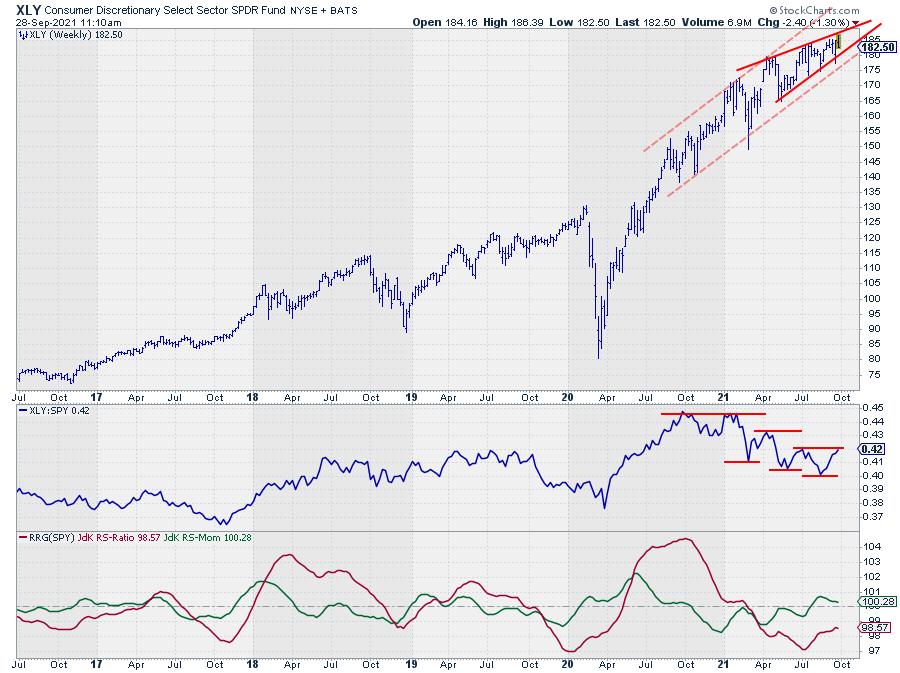
The relative strength for XLY vs SPY is showing a series of lower highs and lower lows which is what we want to see for shorts. The last relative rally managed to get back to the level of the previous high which is stronger than expected.
That recent hiccup in relative strength also clashes with the price pattern that seems to be forming on the price chart. Since April/May a rising wedge seems to be in the making. After an uptrend, that qualifies as a reversal pattern when executed, usually followed by an acceleration lower.
That wedge pattern will be complete on the break below the support line that marks the lower boundary of the formation. As you can see, the lower boundary of the rising channel, light shaded support line, is nearby. Breaking that support as well will only add to the confirmation that the trend has reversed.
I am watching 175, at a Friday close, as the trigger for an acceleration lower. For the time being XLY can stay in the short basket.
ORCL to Replace EXR
In today's episode of Sector Spotlight, I highlight the Technology sector as potentially interesting from a seasonal point of view but mentioned the rotation on the RRG not being too supportive (yet). With today's knowledge (S&P down 1.8%, and XLK down 2.5%, as I am writing this, that caveat seems to step to the forefront.
However, when diving into the tech sector at the individual stock level there are still some interesting rotations to be found. One of those is for ORCL.
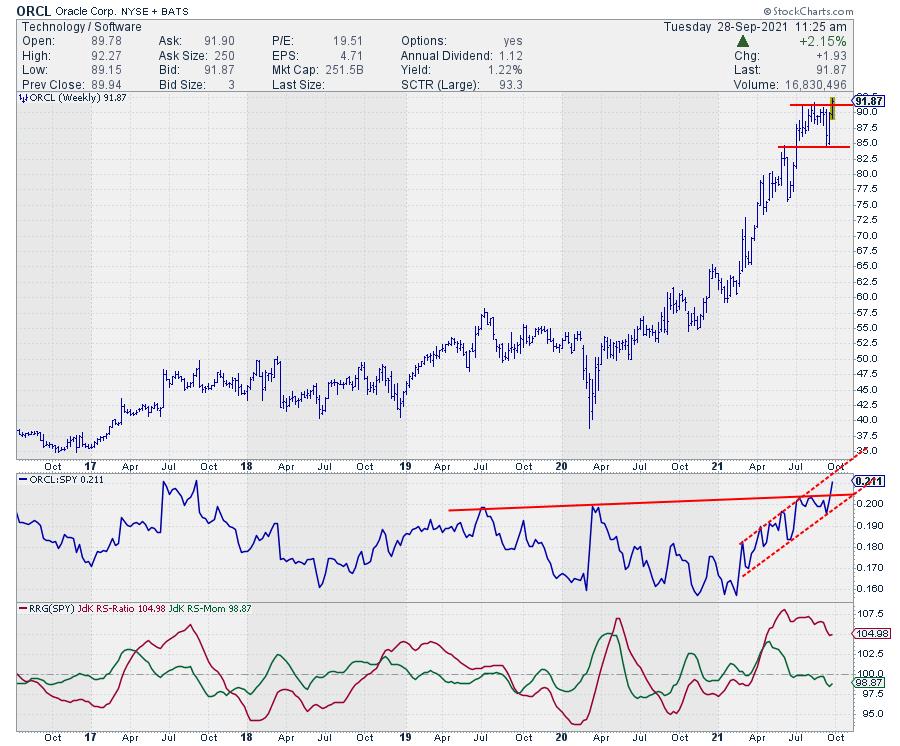
On the RRG, ORCL is inside the weakening quadrant after a strong rotation through leading but is now rapidly picking up both relative strength and relative momentum again, putting the tail back on track for a rotation towards leading again.
The price chart above shows that ORCL is now breaking to new highs which in itself is already a strong sign of (relative) strength when the sector it belongs to drops 2.5%.
Based on this strength and the expected seasonal strength for the sector, although it does not look as if that will apply to the entire sector this year, I am adding ORCL to the long basket, replacing EXR.
Current Basket
LONG : WM, CRM, ORCL
SHORT: XLY, SWKS, PSX
#StaySafe, --Julius
Julius de Kempenaer
Senior Technical Analyst, StockCharts.com
Creator, Relative Rotation Graphs
Founder, RRG Research
Host of: Sector Spotlight
Please find my handles for social media channels under the Bio below.
Feedback, comments or questions are welcome at Juliusdk@stockcharts.com. I cannot promise to respond to each and every message, but I will certainly read them and, where reasonably possible, use the feedback and comments or answer questions.
To discuss RRG with me on S.C.A.N., tag me using the handle Julius_RRG.
RRG, Relative Rotation Graphs, JdK RS-Ratio, and JdK RS-Momentum are registered trademarks of RRG Research.


