In a recent conversation, somebody mentioned "New York Fang" to me. I was under the impression he was referring to the FANG stocks. Only later did I understand that he was talking about an ETF and an associated index which is a bit broader than "just" FANG or FAANG.
The ETF I am referring to is FNGS. The official description for this ETF, or more correctly ETN, is as follows:
The MicroSectors™ FANG+ ETN is an exchange-traded note issued in the USA. The ETN tracks the return of the NYSE FANG+ Index. The NYSE FANG+ Index is an equal-dollar weighted index designed to represent a segment of the technology and consumer discretionary sectors consisting of highly-traded growth stocks of technology and tech-enabled companies.
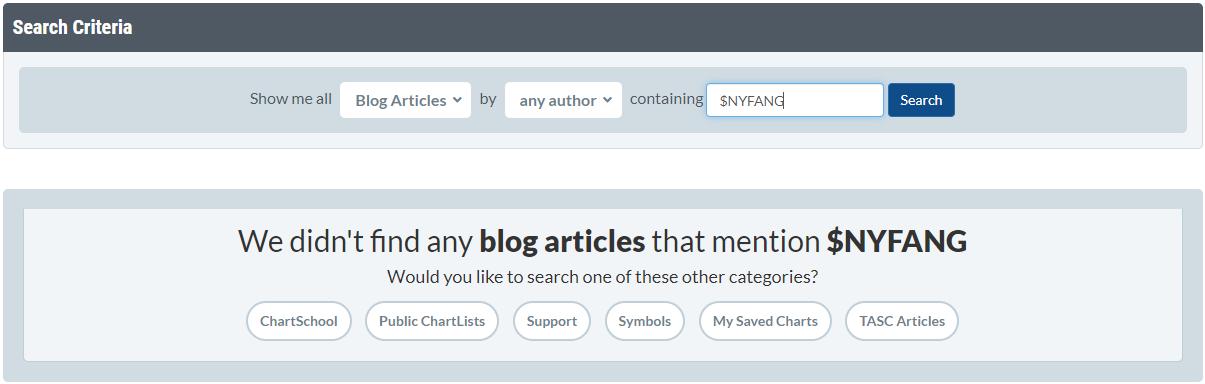
The NYSE FANG+ index is present on StockCharts.com under the ticker symbol $NYFANG.
When I searched for both symbols in articles on the site I found ZERO mentions....
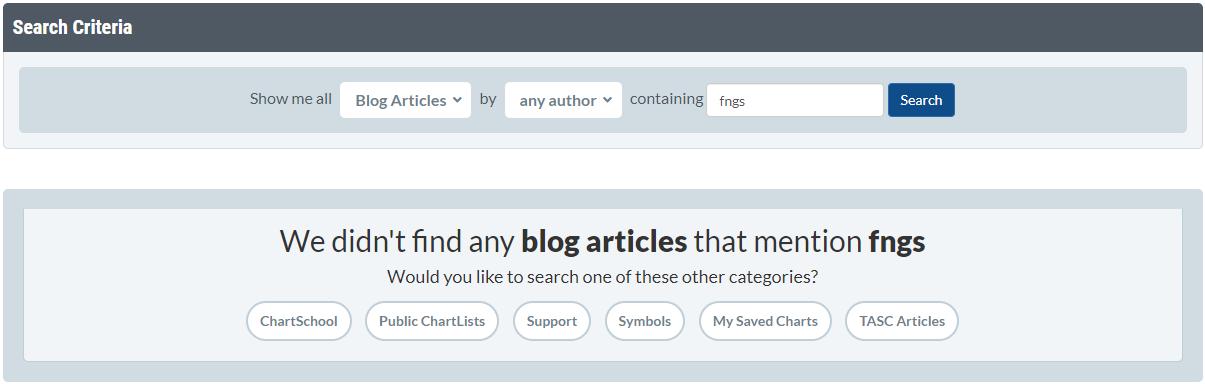
So basically the "nobody" in the title refers to the commentators here on the site, but I'm willing to take a gamble that if none of the commentators here on StockCharts are looking at this index or ETF, not a lot of people out there are looking at it or using it either.
Now that we've "found" it, let's break it down and see how it looks on the charts and the RRG.
If we start with the breakdown of the components using the table that you can find below each Relative Rotation Graph, we see that there are 10 stocks in this index and they are equal dollar-weighted, so no dominance from any mega-cap stock.
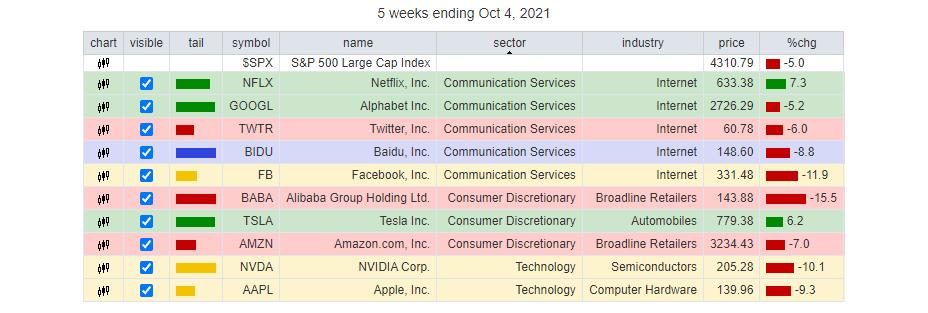
Looking at the breakdown across the various sectors, we find five stocks from the Communication Services Sector, three consumer discretionary and (only) two from the technology sector. Pretty heavy in the Communication Services space. However, we do not have to wonder which sector we should use as the benchmark, as the $NYFANG index will do that just fine.
Let's start with a look at the chart of this $NYFANG index in relation to the S&P 500.
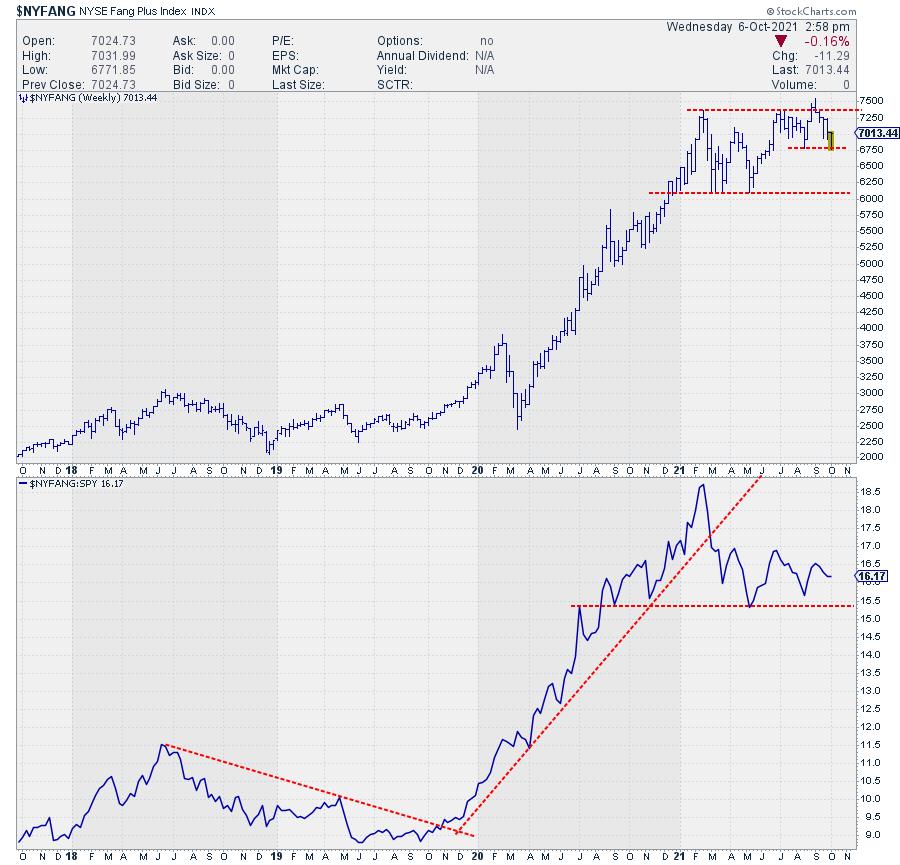
Calculation of the index started somewhere in 2017 and, until mid-2018, $NYFANG clearly outperformed the S&P 500. From the 2018 relative peak onward, the $NYFANG stocks underperformed the market for an 18-month period until the end of 2019.
In late 2019, the relative strength of $NYFANG against SPY started to accelerate and rise steeply. It continued to do so at an unprecedented pace until March of this year, when the RS-Line steeply dropped and broke below the rising support line that had been intact since late 2019.
From March onward, the relative movement has been more or less sideways, and an important relative level seems to be building up just below 15.5, where a few important lows were formed.
Throwing the members of this index on a Relative Rotation Graph gives us the picture below.
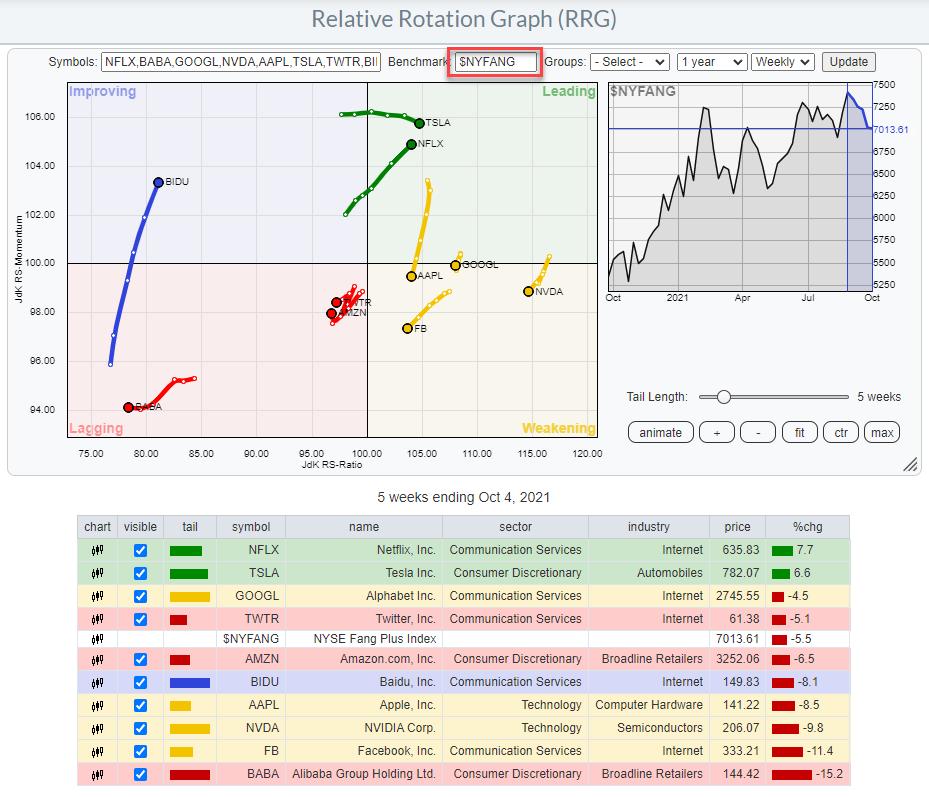
A few takeaways from the rotations which are visible on this chart. The first is that the majority of stocks are moving at a negative RRG heading. Only two are at a clear positive heading, BIDU and NFLX, while TSLA is comfortable inside the leading quadrant but slightly dropping on the JdK RS-Momentum scale.
The tail for BABA is clearly the weakest and it is still pushing further into negative territory. TWTR and AMZN are inside lagging but showing very erratic tails, with no clear heading or direction. However, the fact that they are inside the lagging quadrant and at short tails suggests that they are in stable relative downtrends.
BABA
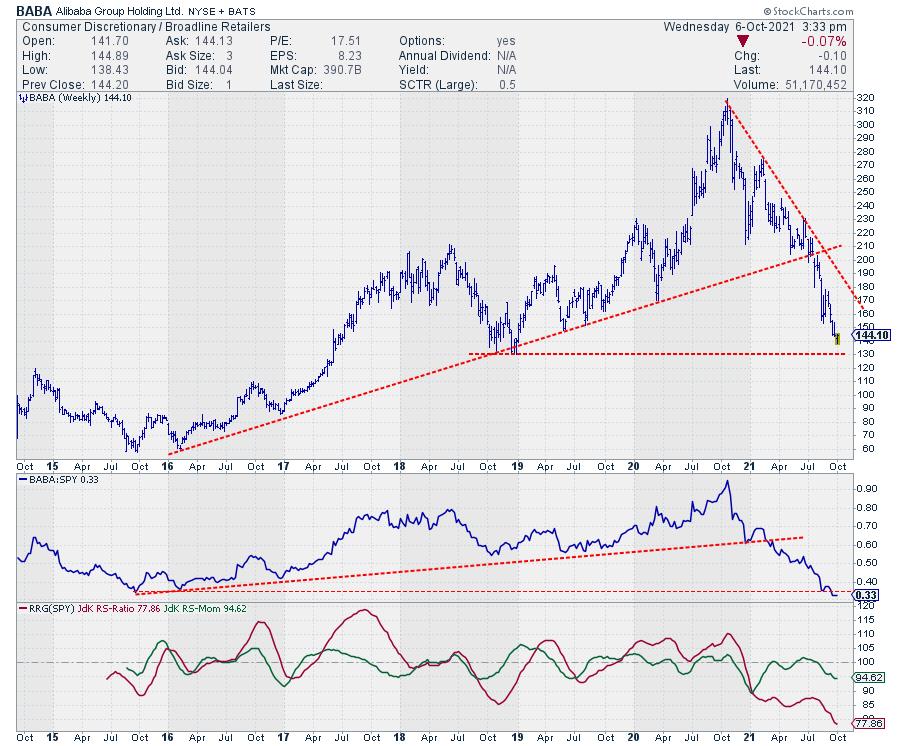
The chart of BABA vs. SPY as the benchmark (more history available than for $NYFANG) confirms the position on the RRG. On both the price chart and the relative chart, major trends have been broken and the downward trends are visible. Support may be expected in the area around $130, where an important low was formed back in 2018. However, the downtrend is so strong that it is very unlikely that it will revert anytime soon. Within the current downtrend, a significant move higher can occur without turning the current trend around.
So within this universe of NY FANG+ stocks, BABA is probably the one that is better avoided, unless you are looking to play an upward bounce within a downtrend. But, in my experience, these are notoriously dangerous.
NFLX
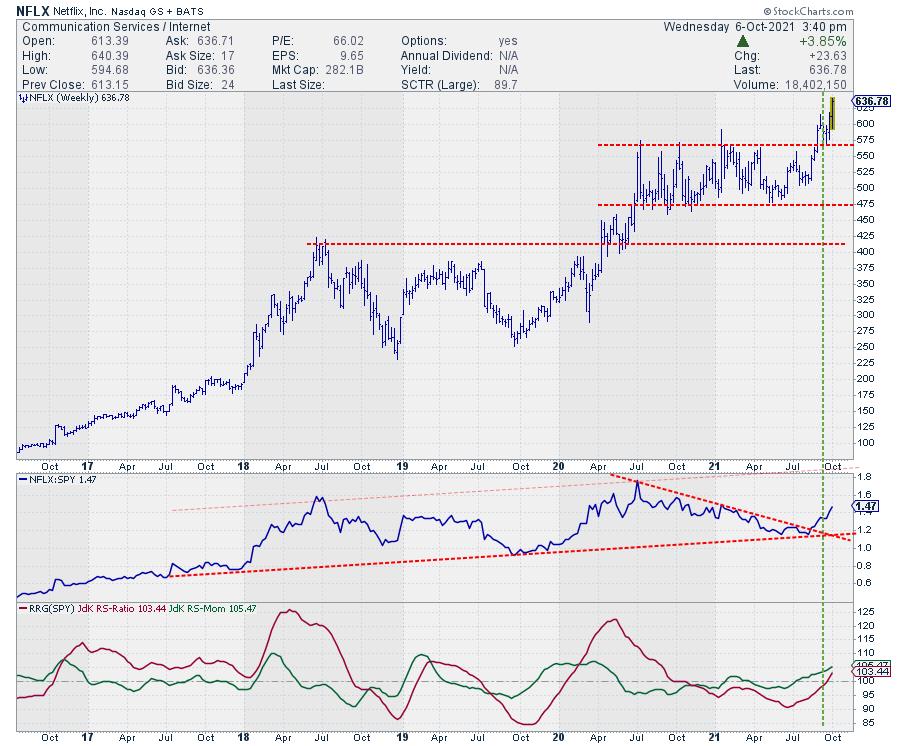
On the positive side, NFLX seems to hold the strongest cards. The tail is moving further into the leading quadrant at a strong RRG-Heading. Looking at the price chart shows that NFLX broke from a year-old trading range a few weeks ago, tested that old resistance level as support and jumped higher from there and is now taking out its most recent high.
Relative strength is following that move and seems to have turned around the relative downtrend that was visible since mid-2020, after bottoming against a longer-term rising support line that has been in play since 2017. And with a little fantasy, that line can even be extended backward to the lows from early 2015. This means that NFLX now seems to be embarking on a new up-leg within a long-term relative uptrend.
Wrap
All in all, the $NYFANG index as a whole seems to continue its loss of (relative) strength and should therefore be approached with care. Within the index, BABA looks to be the worst stock, while NFLX is looking strong after breakouts in both price and relative terms.
FNGS is the tradable ETN (Electronic Traded Note) that tracks the $NYFANG index, just like SPY is the tradable ETF that tracks $SPX.
#StaySafe, --Julius
Julius de Kempenaer
Senior Technical Analyst, StockCharts.com
Creator, Relative Rotation Graphs
Founder, RRG Research
Host of: Sector Spotlight
Please find my handles for social media channels under the Bio below.
Feedback, comments or questions are welcome at Juliusdk@stockcharts.com. I cannot promise to respond to each and every message, but I will certainly read them and, where reasonably possible, use the feedback and comments or answer questions.
To discuss RRG with me on S.C.A.N., tag me using the handle Julius_RRG.
RRG, Relative Rotation Graphs, JdK RS-Ratio, and JdK RS-Momentum are registered trademarks of RRG Research.


