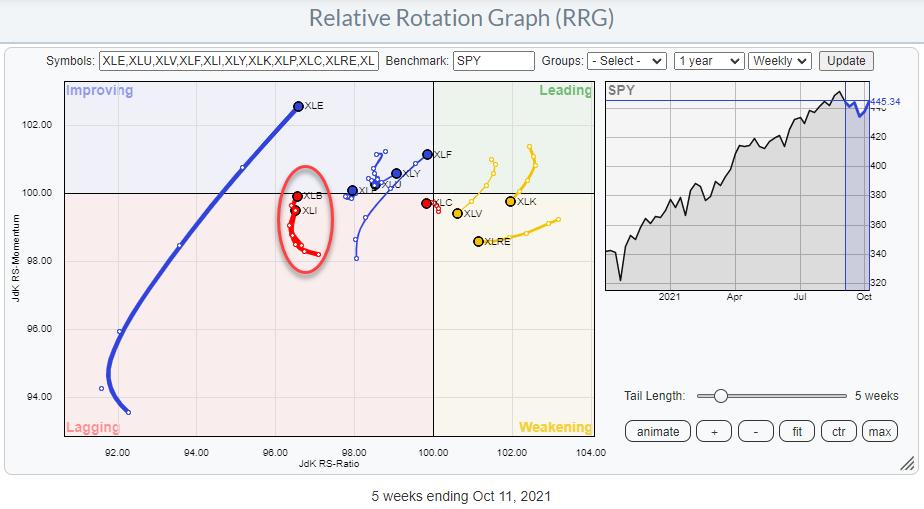
The sector rotations on the Relative Rotation Graph are still confusing. The Consumer Staples and Discretionary sectors are currently moving in the same direction where they normally move in opposite directions. Based on rising rates, one would expect both Banks/Financials and Real-Estate to benefit, but where XLF is definitely on a positive rotational trail, Real Estate is inside the weakening quadrant and heading towards lagging. Also, when I look at a basic breakdown of sectors between offensive and defensive, there is no coherent rotation visible among these groups.
Offensive/Cyclical Sectors
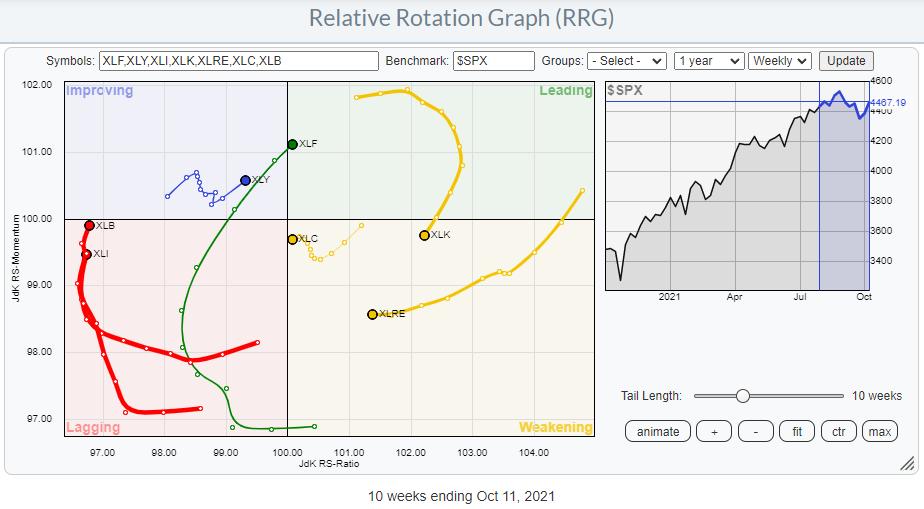
Looking at a group of sectors that is considered "offensive" or cyclical in nature, there does not seem to be a general direction for the rotations. A few sectors like Financials and Consumer Discretionary are showing positive, while Materials and Industrials are showing an improvement in terms of JdK RS-Momentum. But Communication Services and Technology, together with Real Estate, are on negative rotational trails.
Defensive Sectors
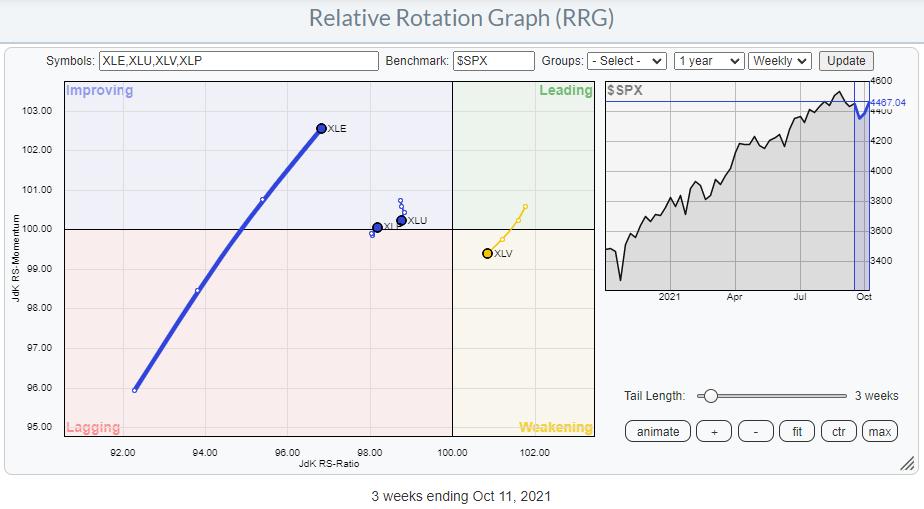
The same goes for the more defensive sectors, where Energy is on a strong RRG-Heading and a long tail while Healthcare is heading towards the lagging quadrant. Utilities and Staples are both inside improving, but on a very short tail and hardly showing any directional momentum.
Near Term S&P Improvement
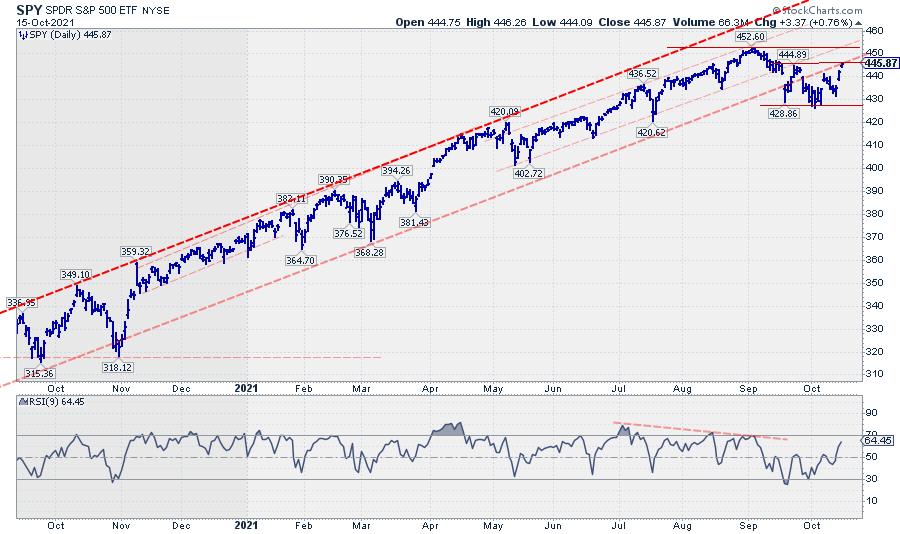
After breaking out of its rising channel and finding support around 430, the S&P started showing some improvement, at least for the near term. The low(s) around 430 are now firmly in place and they are expected to form support. Given the break from the channel, there are now various resistance levels on the way up.
The first one is the previous high around 445. That level coincides with the current level of the old rising support line, which is now expected to provide resistance. So 445 seems to be the first area of resistance that the market needs to overcome. Once that level can be cleared the next, even more, important resistance level is showing up at 452.50, where the previous peak and all-time-high was formed.
Therefore, despite the short-term improvements, the upside still needs some work. That becomes even more clear when we switch to a weekly chart.
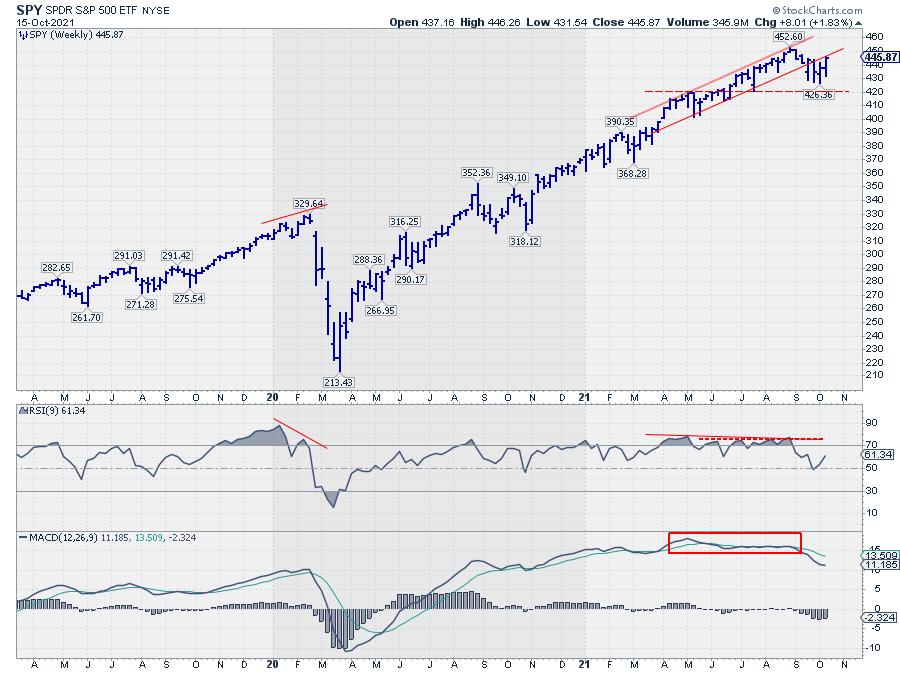
These weekly bars show the bigger picture without the day-to-day noise. As you can see, the current bar (this week) is now pushing against the former support line, and it looks as if we have completed one move down from the high. Nothing more, nothing less.
The negative divergences between price and RSI / MACD are still intact and they show no signs of a reversal anytime soon. Therefore, the big question is where will the next high be formed on this chart. If the current swing higher takes the S&P, on this weekly chart, above 452.60, higher highs and higher lows remain in place. If, on the other hand, the next high on this chart comes in below 452.60 and then the recent low at 426.30 gets broken, things will start to shift more seriously.
For the time being, I'd like to keep both options or scenarios open and not get positioned strongly into either direction.
#StaySafe, --Julius
Julius de Kempenaer
Senior Technical Analyst, StockCharts.com
Creator, Relative Rotation Graphs
Founder, RRG Research
Host of: Sector Spotlight
Please find my handles for social media channels under the Bio below.
Feedback, comments or questions are welcome at Juliusdk@stockcharts.com. I cannot promise to respond to each and every message, but I will certainly read them and, where reasonably possible, use the feedback and comments or answer questions.
To discuss RRG with me on S.C.A.N., tag me using the handle Julius_RRG.
RRG, Relative Rotation Graphs, JdK RS-Ratio, and JdK RS-Momentum are registered trademarks of RRG Research.


