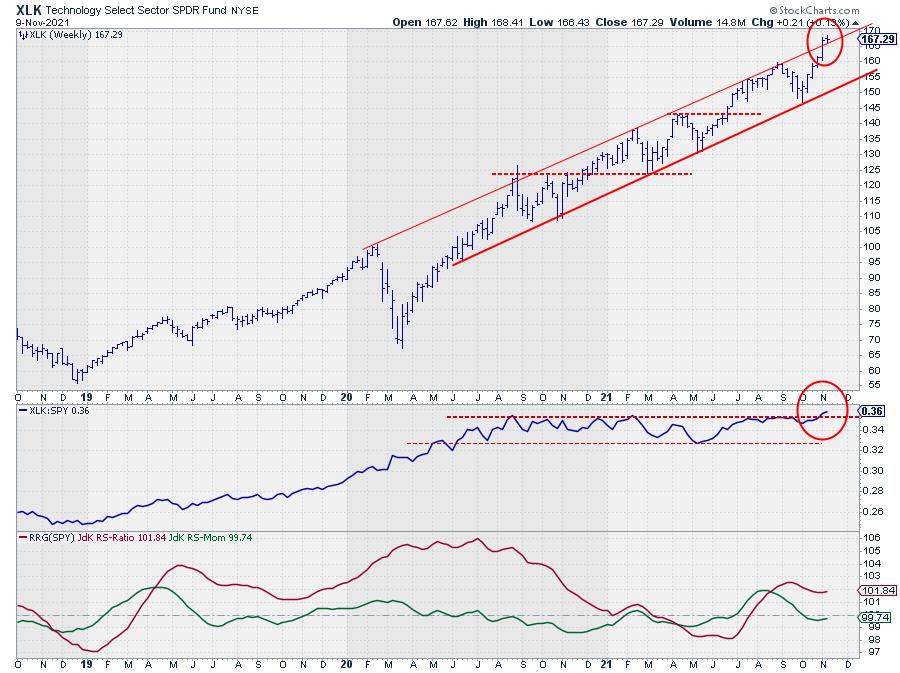
This may seem an odd title because, you might say, "tech broke out ages ago." While that is true with regard to price, it certainly was not the case for relative strength.
The (raw) RS-Line peaked back in August 2020 and has moved sideways in a narrow range since then. This does/did not make Technology a bad sector -- price was nicely rising in a channel, so no complaints there. But what it did mean is that the rise in price for the technology sector was in-line with the market and tech was not OUTperforming that market.
This is best illustrated by the following table, which lists the performances per sector from 8/24/2020 to 11/1/2021.
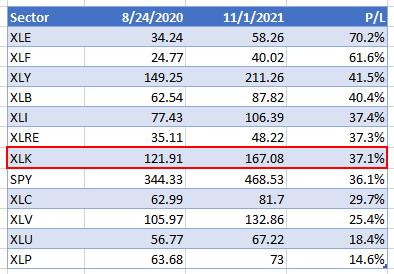
The technology sector only ranks 7th in that list at 37.1%, just 1% above the benchmark (SPY) that came in at 36.1%, hence "a performance in line with the benchmark" and therefore a more or less horizontal/sideways relative strength line.
With the upward break of relative strength out of that sideways range, that period has now come to an end. Unless we are getting tricked by the market and RS falls back into the range in the next week or so, that is, but the simultaneous upward break on the price chart supports a further improvement.
Very often, when price breaks upward out of an already rising channel, we see an acceleration in the rally.
In yesterday's episode of Sector Spotlight, I showed my newly adopted breakdown as presented by Morningstar (thanks again Louis). In this breakdown, we not only divide between offensive and defensive/cyclical sectors, but also "sensitive" sectors. Technology/XLK is one of these sensitive sectors. In the same show, I also looked at how current sector rotation is playing out in Equal-Weight sectors as well as Small-Cap sectors.
For this article, I want to highlight the rotations for the tech sector in all three segments.
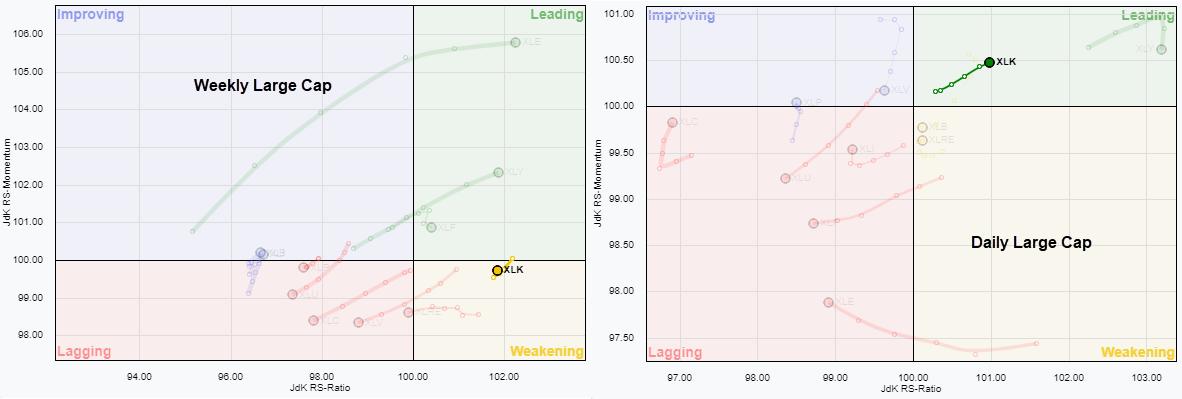
Large Cap
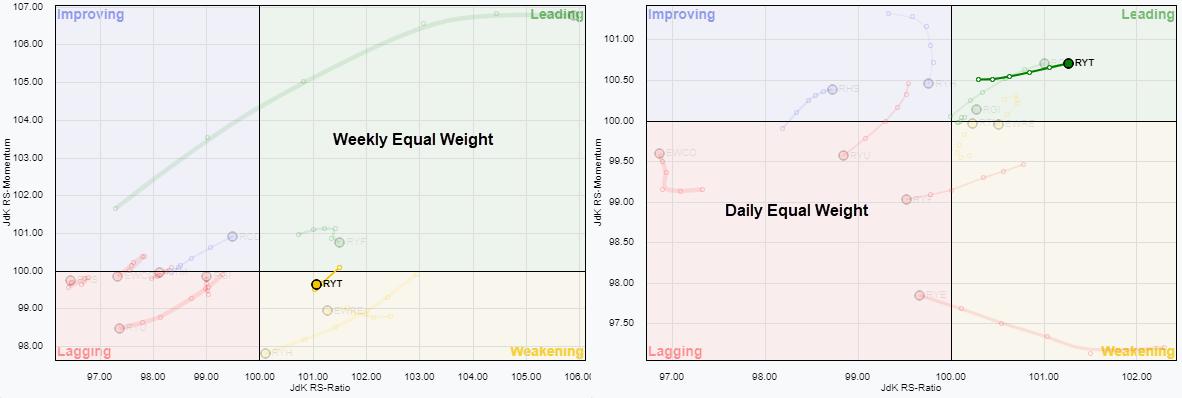
Equal Weight
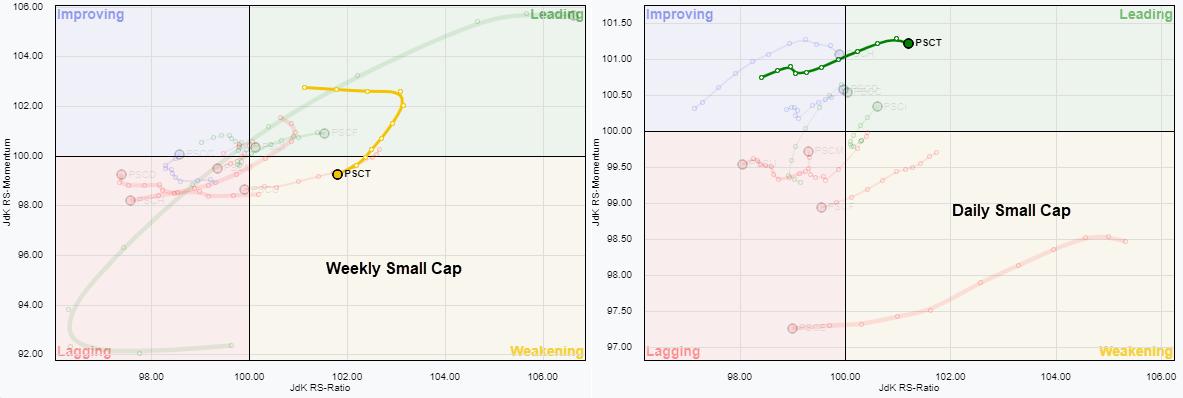
Small Cap
When you click anywhere in one of the graphs above, it will open up a new window with a live version of the RRG. If you would like to save a copy of this setup for your own use, you can bookmark the URL. This will allow you to bring up the RRGs for these universes from your bookmarks, saving you the effort of setting them up each time.
What Can We Learn from these RRGs?
First of all, all three sets of weekly vs daily rotations are looking quite similar. The weekly tails are all inside the weakening quadrant. Although it's quite hard to see on the images, when you open the live version and zoom in on the technology tail, it's very clear XLK and RYT have already "hooked" back up, which we know is a strong sign. PSCT, in the small-cap universe, is not there yet.
The daily tails are all inside the leading quadrant and moving higher on the Jdk RS-Ratio axis. Given the high reading for tech in each segment, the big picture takeaway is that, based on JdK RS-Ratio, the technology sector is already in a relative uptrend, which is going through a setback. A rotation for the weekly tails back into the leading quadrant will be the confirmation that a new up-leg in that relative uptrend is underway.
The RRGs above are all plotted against their respective benchmarks, so large-cap vs. SPY, Equal Weight vs. RSP and small-cap vs. $SML.
The RRGs below show all three tech tails vs, SPY which IMHO, makes the picture pretty clear.
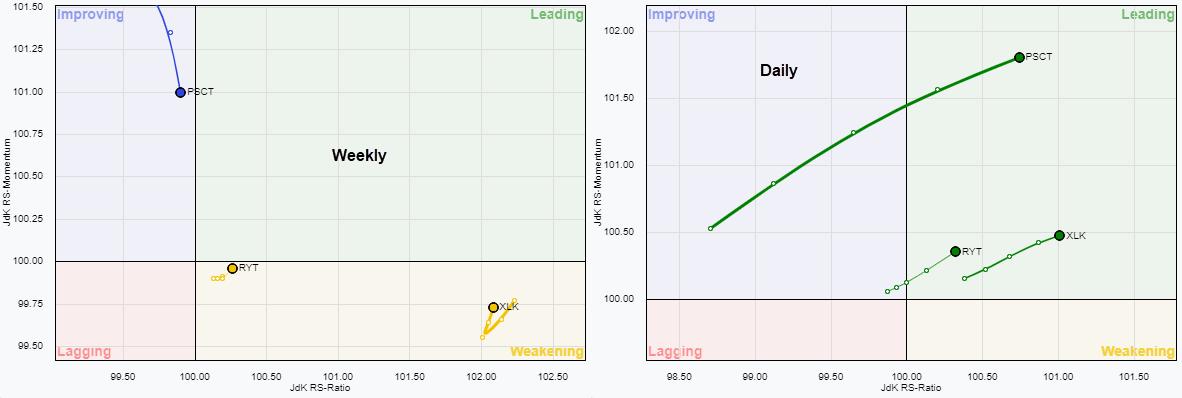
The hooks on XLK and RYT inside weakening are clearly visible, while the short-term improvement for all three sector equivalents becomes visible in the daily RRG.
Price Pays, So Always Check the Price Chart
The chart for XLK is already at the top of this article, but I am adding it again for easy reference.

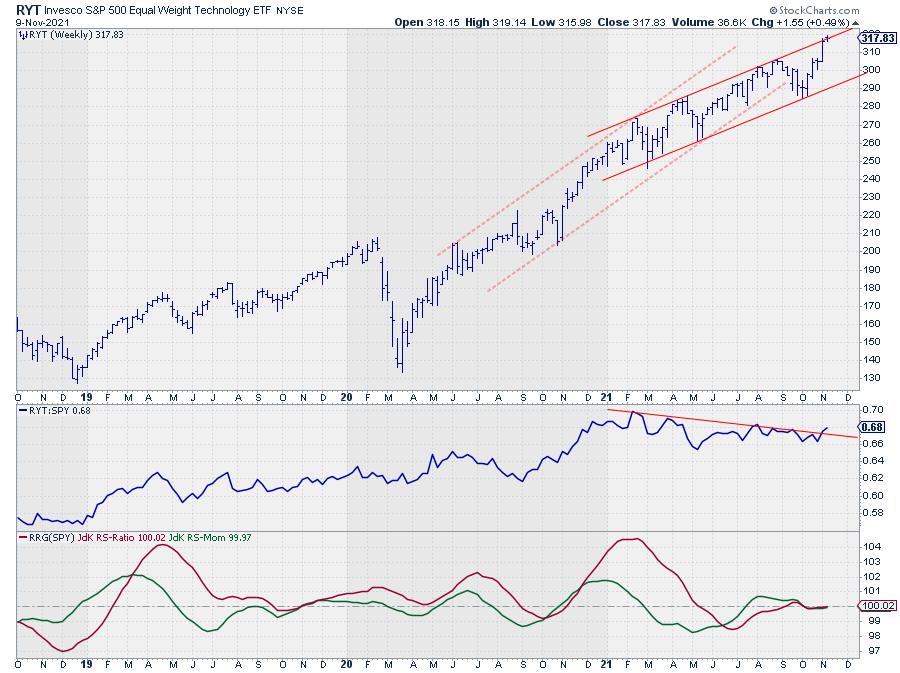
RYT lost some of its pace (momentum) at the start of this year, which resulted in the RS-line declining to a lower level and stabilizing there. Here, we also see an upward break of (falling) resistance and both RRG-Lines around the 100-level, but both rising and ready to push into the leading quadrant.
Last week, RYT broke above its previous high and is now bouncing against the upper boundary of the newly formed channel. An upward break would be very strong, but even remaining inside the channel will be positive.
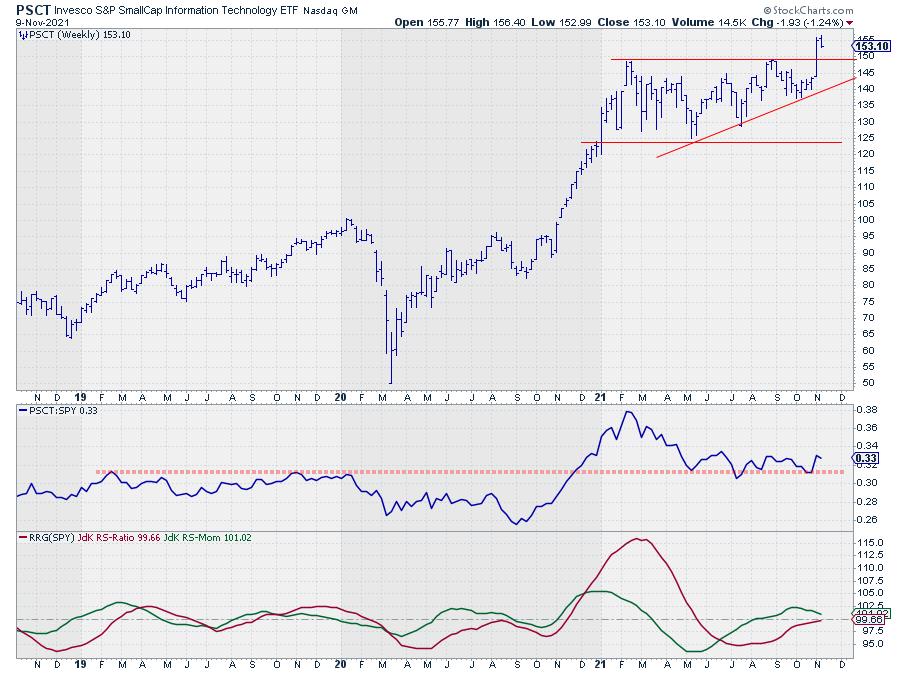
PSCT probably has the weakest RS-line/RRG configuration at the moment but the strongest price chart. Last week, PSCT managed to break above horizontal resistance, which kept it capped since February. That hurdle has now been taken and the breakout level (~150) will now very likely start to act as support. If that holds, the RS-Line will most likely bounce of its support area, where it currently is, which will turn the RRG-Lines back up and make the tail on the RRG rotate towards the leading quadrant (weekly chart).
All in all, I think the Technology sector is back on track, which will very likely have a positive effect on the S&P 500 as well.
#StaySafe, --Julius
Julius de Kempenaer
Senior Technical Analyst, StockCharts.com
Creator, Relative Rotation Graphs
Founder, RRG Research
Host of: Sector Spotlight
Please find my handles for social media channels under the Bio below.
Feedback, comments or questions are welcome at Juliusdk@stockcharts.com. I cannot promise to respond to each and every message, but I will certainly read them and, where reasonably possible, use the feedback and comments or answer questions.
To discuss RRG with me on S.C.A.N., tag me using the handle Julius_RRG.
RRG, Relative Rotation Graphs, JdK RS-Ratio, and JdK RS-Momentum are registered trademarks of RRG Research.


