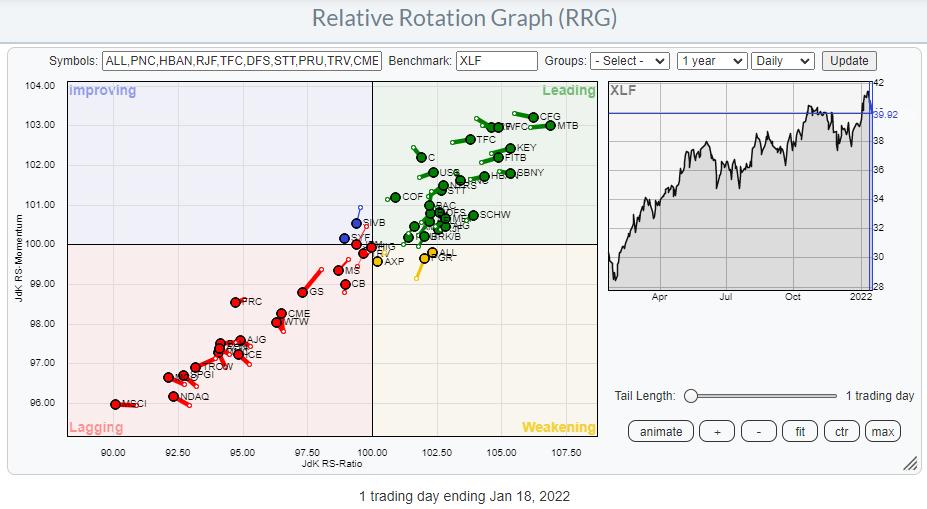
On the back of a lot of earnings announcements, the financial sector is getting a lot of attention this week. A few stocks, led by SIVB, FRC and GS, got hurt pretty bad yesterday with >5% declines.
The RRG above shows the (top 50) stocks inside the financial sector. As you can see, there is a large group moving further into the leading quadrant at a strong RRG-Heading, while there is an almost equally large group traveling deeper into lagging at a negative RRG-Heading.
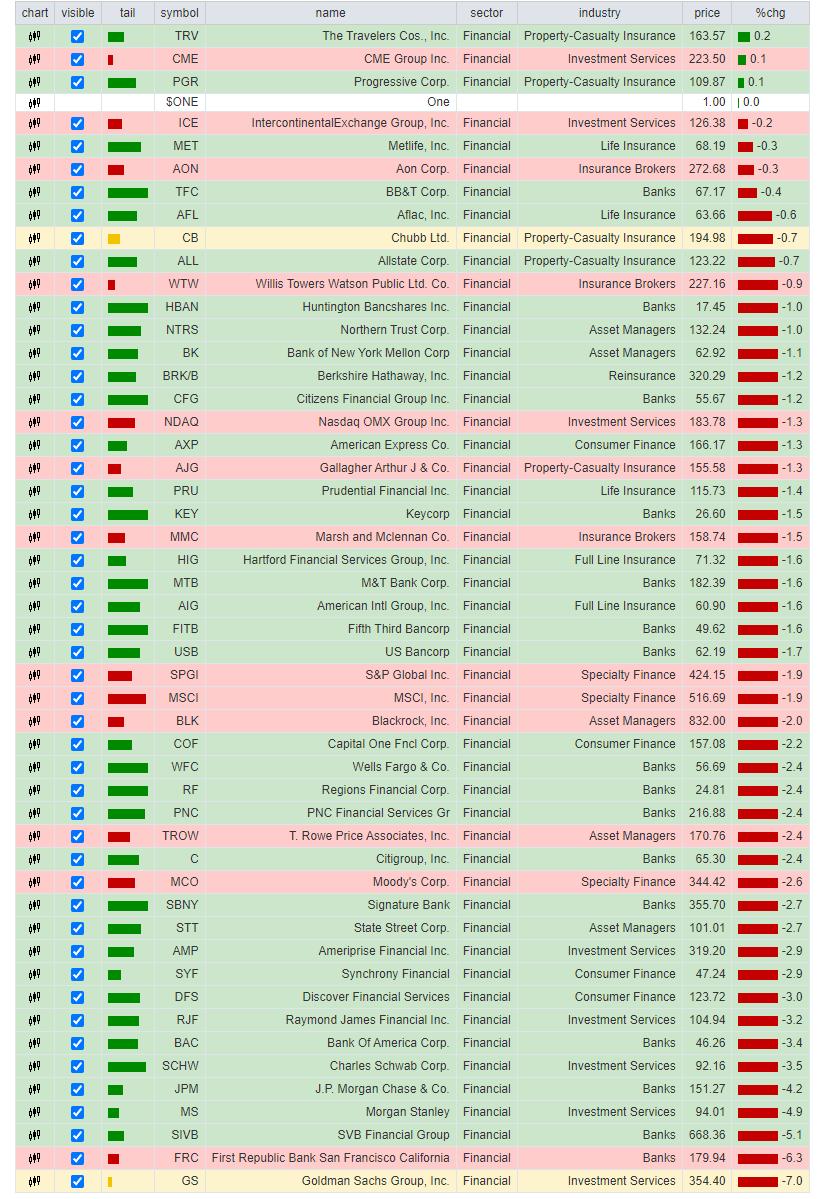
Looking at the performance table plotted below the RRG, we can see that the bottom part is mainly populated by banks and investment services. And the "banks" at the bottom of the list are heavily involved in investment-related activities. For example, GS and MS are technically not "banks" but investment services companies.
It is interesting to see that, at the top of the list we also find investment services companies like CME and ICE. My take on this dispersion is that CME and ICE are both exchanges, providing a service (access to markets) that benefits from a lot of activity (=volatility). The companies at the bottom of the list are important users of those exchanges and they, in a way, also benefit from a lot of activity. But what they don't like, especially the trading desks, is inconsistent activity or volatility.
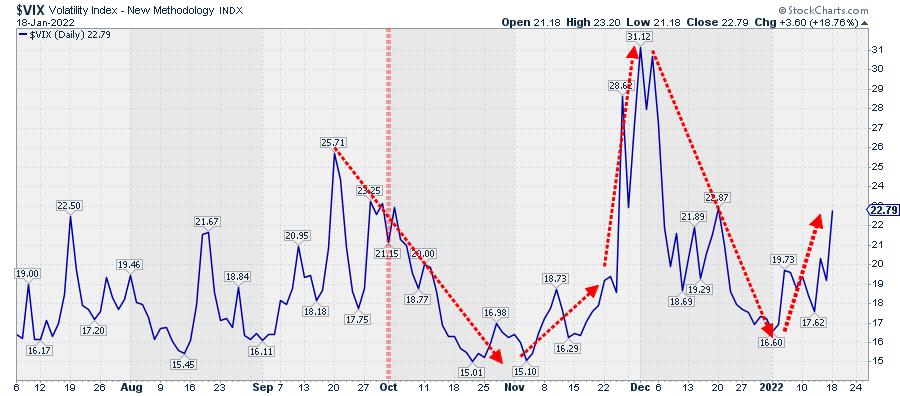
The VIX index above shows how volatility continued to decline into Q4 of 2021, then rapidly shot up to levels above 30 at the start of December, followed by an equally rapid decline back to levels below 20 at the end of the year. These are difficult conditions for trading desks to consistently make money. And that is reflected in the earnings of companies like GS.
However, there are many more groups and stocks inside the financial sector than just banks and investment-related companies. And not all banks are (investment) banks. To get a clearer picture of rotations inside the financial sector, I have plotted the Relative Rotation Graph for the industries inside the sector below.
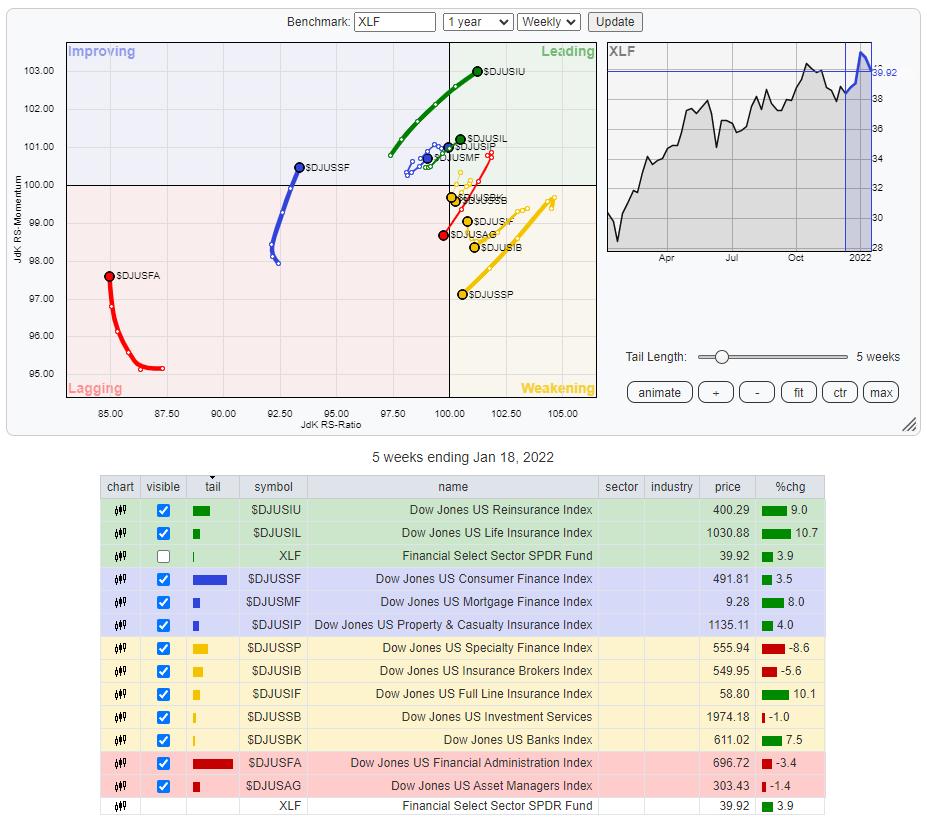
There are a few clear trends/rotations visible.
Financial Administration is deep inside the lagging quadrant, moving up on the RS-Momentum scale recently but still a ways to the left and unlikely to make the complete rotation to leading from here. Consumer Finance is inside the improving quadrant and rising on the RS-Momentum scale. Given the position of the other industries, Consumer Finance also seems too low on the JdK RS-Ratio scale to make it all the way to leading from here.
Inside the weakening quadrants, we find four tails that are heading towards lagging (RRG-Heading between 180-270 degrees). These groups are Specialty Finance ($DJUSSP), Insurance Brokers ($DJUSIB), Investment Services ($DJUSSB) and Banks ($DJUSBK).
The stronger industries at a strong RRG-Heading and inside or approaching the leading quadrant are Reinsurance ($DJUSIU), Life Insurance ($DJUSIL), Mortgage Finance ($DJUSMF), Property & Casualty Insurance ($DJUSIP) and, inside weakening but rotating back up towards leading, Full Line Insurance ($DJUSIF).
Are you seeing the same theme I noticed? ;)
All these groups that are traveling at a positive heading and in a relative uptrend against XLF are related to the Insurance industry. So, going forward, it looks like the various insurance-related groups will be driving the financial sector.
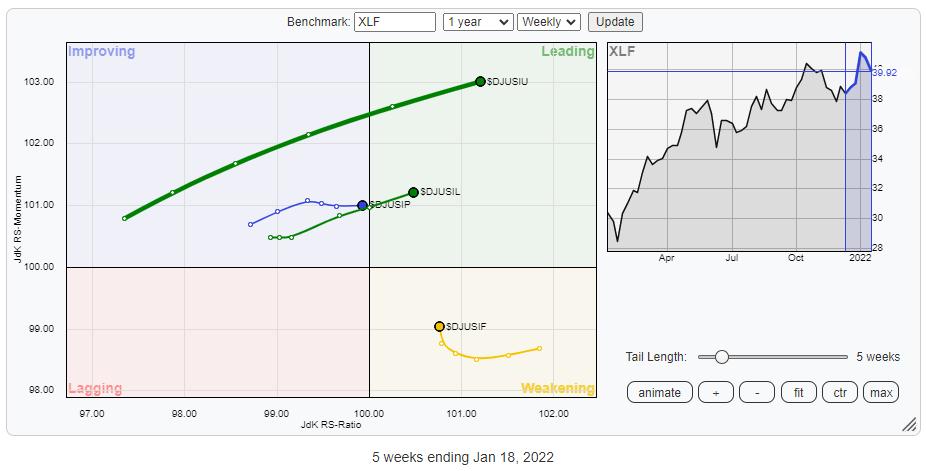
The RRG above isolates these four insurance-related groups so their rotations are better visible.
Reinsurance Index
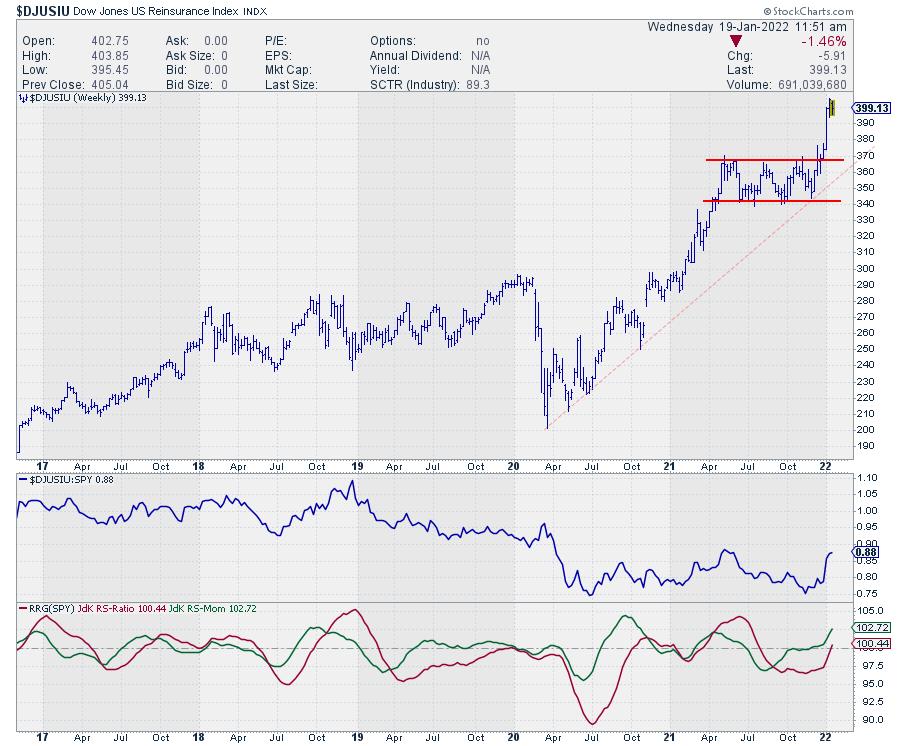
This index is currently moving fastest and highest on the RS-Ratio scale. The improvement in relative strength, as well as price, is obvious, but the fast move higher after breaking away from the consolidation also means this group has quite a bit of risk for a pullback. Be warned that this is a small group. There are only two stocks in this group that are also in the S&P 500. These are Berkshire Hathaway BRK/B, and Everest Re Group RE. Extending the universe to the S&P composite 1500 adds another three.
I prefer not to chase and wait to possibly get better entry opportunities on a drop back, while relative uptrend and breakout remain intact.
Life Insurance
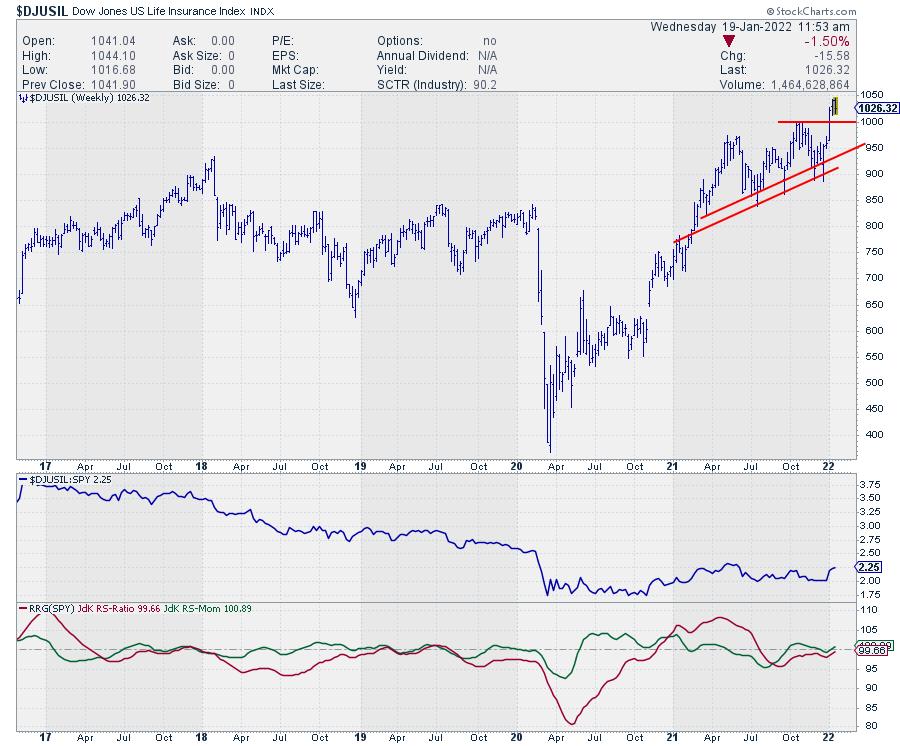
Life Insurance is on a similar trajectory as Reinsurance, but at lower levels on both scales. This means it is earlier in the rotation than Reinsurance. The same goes for the price chart, where Life Insurance has less downside risk and therefore, most likely, better upside potential (risk/reward).
Property & Casualty Insurance
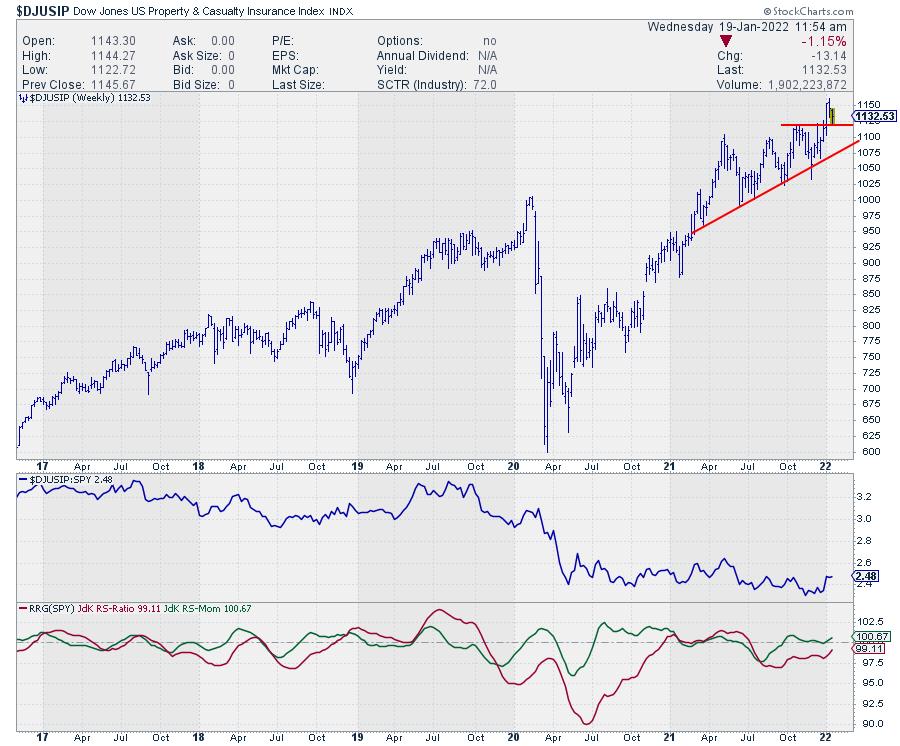
On the RRG, Property & Casualty Insurance is still inside the improving quadrant, but very close to crossing over. Price already broke out of its consolidation and now testing the old breakout resistance level as support. As long as that level, around 1120-1125, holds, this looks like a good entry level on the back of improving relative strength.
Full Line Insurance
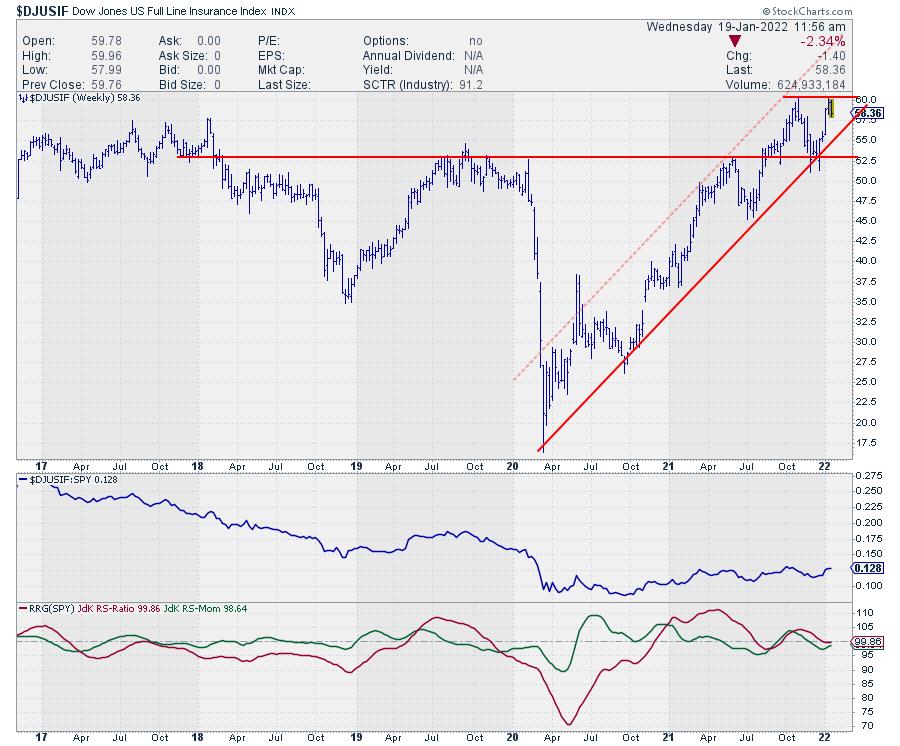
Full Line Insurance already broke above resistance in September, rallied to a new peak at 60, then dropped back to find support at the breakout level. This has caused relative strength to improve and push both RRG lines above 100 and the tail into the leading quadrant. The dip in price and the resulting loss of relative strength has made the tail rotate from leading into weakening, where it has now started to turn back up again as price reached back to its previous peak. What is needed now is a break back above 60 in price and a continuing improvement of relative strength to complete the rotation back to the leading quadrant.
All in all it looks like Property and Casualty Insurance is offering the best risk/reward at the moment, followed by Full Line insurance when that index breaks above 60.
#StaySafe, --Julius
Julius de Kempenaer
Senior Technical Analyst, StockCharts.com
Creator, Relative Rotation Graphs
Founder, RRG Research
Host of: Sector Spotlight
Please find my handles for social media channels under the Bio below.
Feedback, comments or questions are welcome at Juliusdk@stockcharts.com. I cannot promise to respond to each and every message, but I will certainly read them and, where reasonably possible, use the feedback and comments or answer questions.
To discuss RRG with me on S.C.A.N., tag me using the handle Julius_RRG.
RRG, Relative Rotation Graphs, JdK RS-Ratio, and JdK RS-Momentum are registered trademarks of RRG Research.


