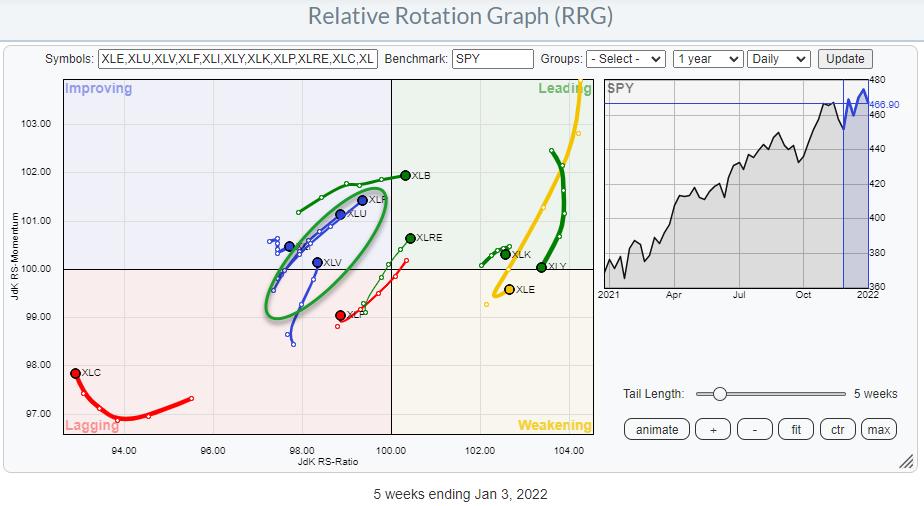
One of the more prominent rotations on the (weekly) Relative Rotation Graph for sectors is the strength displayed by the defensive sectors.
In the RRG above, I have marked an oval around Staples, Utilities and Health Care. These are the three "defensive sectors" in the universe and they are all inside the improving quadrant, traveling at a strong heading towards leading. This type of rotation is usually seen during times of general market weakness when investors seek a safe haven.
Now I am aware of the fact that a bit of a rough week this week, especially last Wednesday. But in the bigger scheme of things, the general trend for the S&P is still rising. Nevertheless, the current strength for defensive is something to be aware of.
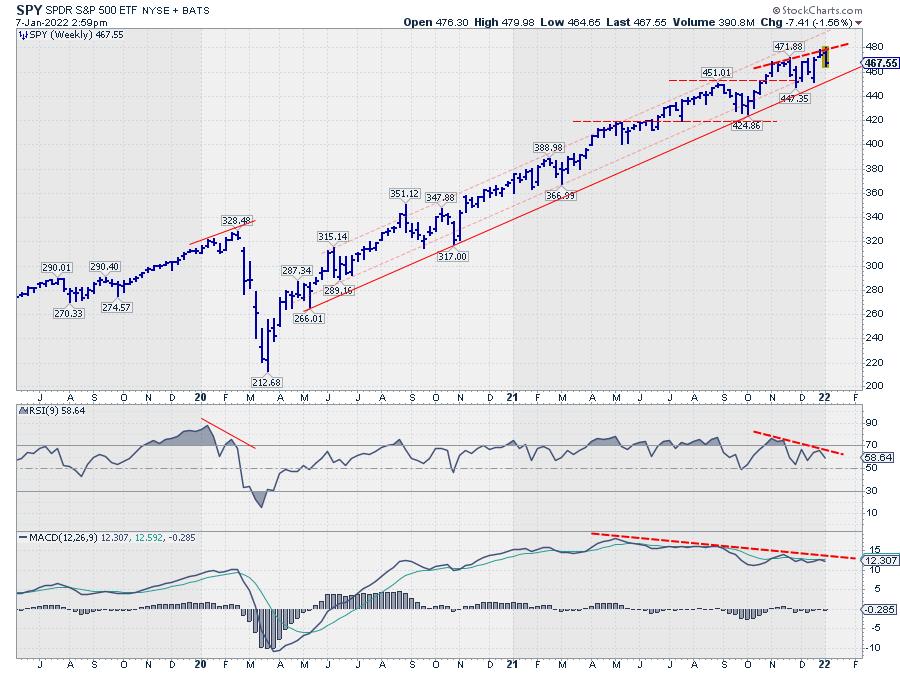
Looking at the chart of the SPY, I have a few observations:
- The series of higher highs and higher lows in price is still intact (+)
- The most recent high did not reach the top of the channel (=/-)
- Price is still above the rising support line that marks the lower boundary (+)
- The negative divergence between price and RSI did come back again (-)
- The negative divergence between price and MACD is still there, but the MACD-line is still way above 0 (=/-)
All in all, I don't think these are signs of a major trend reversal. At least not yet. But it certainly warrants some extra care.
If I break down the universe into three RRGs -- Defensive, Offensive, Sensitive -- this is what we get.
Offensive / Cyclical
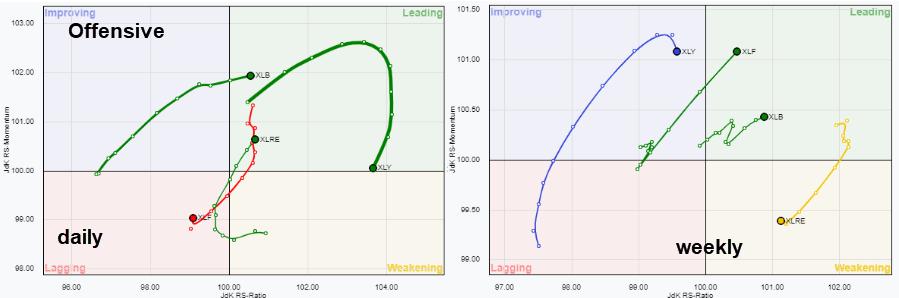
The weekly rotations for XLB and XLRE are still good, both are inside leading and at a strong heading. XLY is rapidly rotating towards weakening, but still at a high RS-Ratio reading. The only clear negative here is XLF.
On the daily RRG, XLB is confirming the positive rotation on the weekly so that is strong. XLF is rapidly moving into leading, but we have to wait and see if that is strong enough to pull the weekly tail around and back to improving/leading. XLRE is inside weakening and seems -- seems -- to be turning back up. If that gets proper follow-through next week, we could see XLRE back as a strong sector again.
The only worrisome rotation on the daily is the rolling over tail for XLY inside improving; this will likely put more pressure on the weekly rotation, which is a weak sign.
Defensive
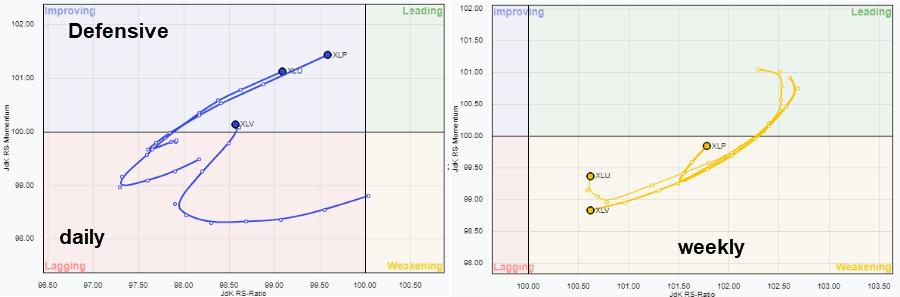
On the weekly RRG, all defensive sectors are rotating strongly into the improving quadrant. Only XLV is slowing down this week.
On the daily chart, all three are inside weakening and the only one NOT YET curling back up towards leading is XLV. All in all, strength for defensive sectors seems to continue.
Sensitive
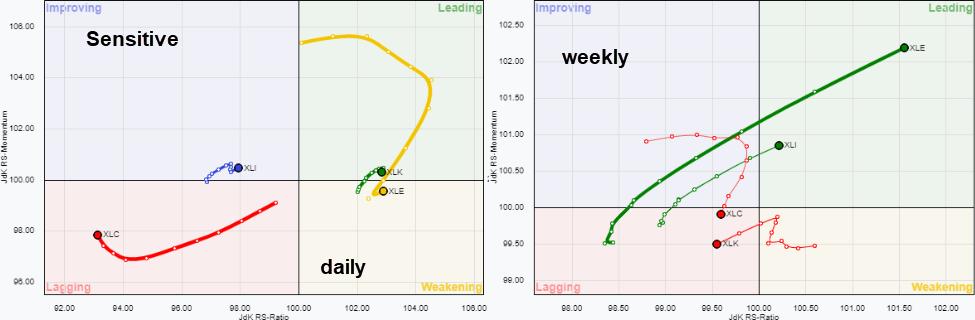
The sensitive group is mixed. The tails for XLE and XLI look promising, as they are both moving in the same direction on both the weekly and the daily charts. XLC is confirming its weakness in both time frames. The worrisome rotation is for XLK, which is at a short tail on the weekly and seemingly rotating lower towards weakening, while the daily tail moved into lagging this week and seems to be heading further into it.
So all in all, the only sectors showing real relative weakness are Technology, Communication Services and, to a lesser degree, Health Care. And you know what? Together that is around 50% of the market cap in the S&P 500...
Therefore, as long as this rotation continues, it will be difficult for the market to move much higher. We do need to get participation from these sectors back, or at least two out of three, I would say.
Long-term uptrend intact, but be careful near-term.
--Julius
Julius de Kempenaer
Senior Technical Analyst, StockCharts.com
Creator, Relative Rotation Graphs
Founder, RRG Research
Host of: Sector Spotlight
Please find my handles for social media channels under the Bio below.
Feedback, comments or questions are welcome at Juliusdk@stockcharts.com. I cannot promise to respond to each and every message, but I will certainly read them and, where reasonably possible, use the feedback and comments or answer questions.
To discuss RRG with me on S.C.A.N., tag me using the handle Julius_RRG.
RRG, Relative Rotation Graphs, JdK RS-Ratio, and JdK RS-Momentum are registered trademarks of RRG Research.


