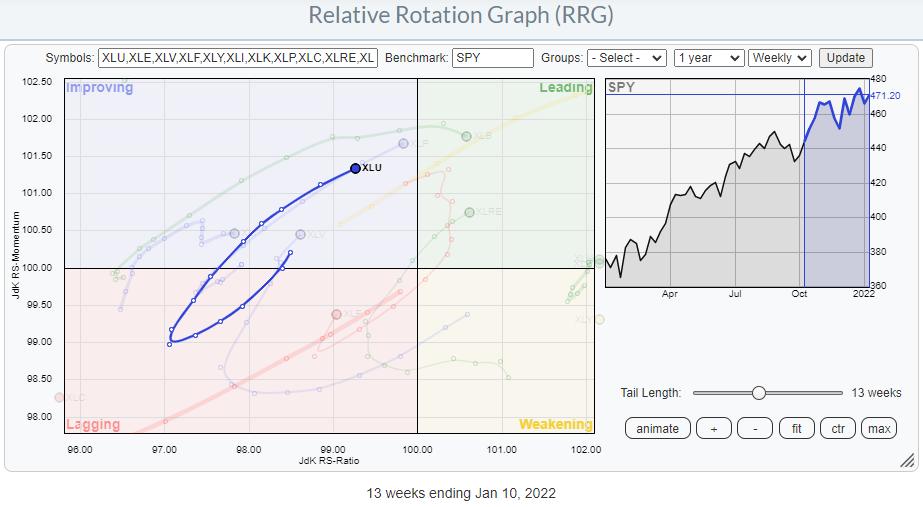
The utilities sector is showing a strong rotation over the last weeks. The sector moved back into lagging from improving in the week starting 18 October, then rotated through lagging and re-entered the improving quadrant again in the week starting 13 December at a strong RRG-Heading.
The next Relative Rotation Graph shows the members inside the Utilities sector against the $ONE benchmark.
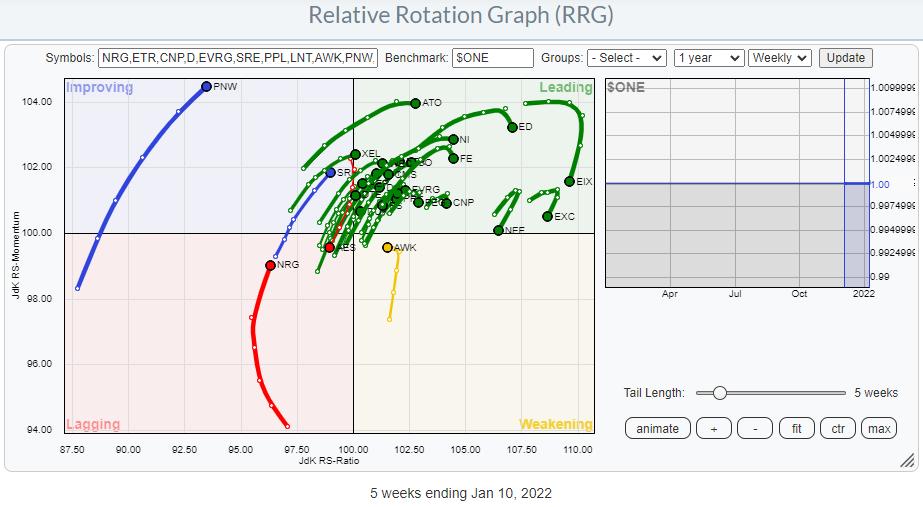 Using $ONE as the benchmark for an RRG shows the price trends instead of the relative trends.
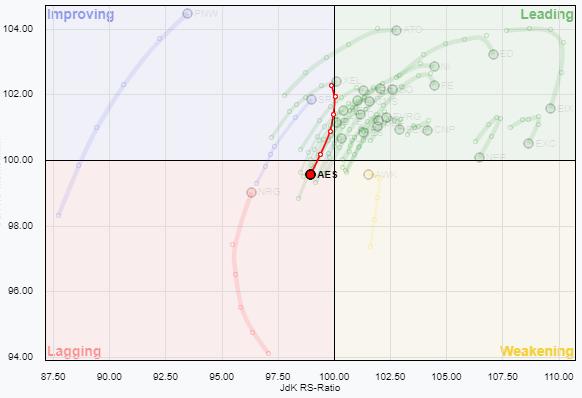 On this graph, the majority of tails are moving at a strong heading (between 0-90 degrees, or North-East), which indicates that the majority of stocks in the utilities sector is moving in an uptrend. There is only one stock in this universe that is really moving counter-trend, which is AES. Almost invisible through all the green tails is one red tail heading lower from improving into weakening (see inset).
The next RRG shows all utility stocks against the S&P 500 .
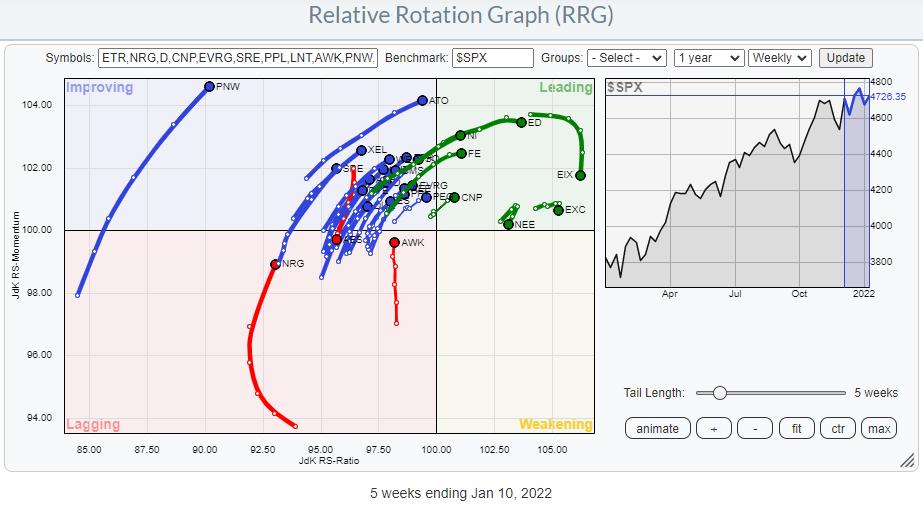
Here also, we see the majority of the tails moving at a strong RRG-Heading inside or towards the leading quadrant. With the sector (XLU) itself moving at a strong heading, this graph shows that the relative strength for the sector is based on broad participation and not driven by only a few stocks.
Finally, we plot the universe of XLU stocks against XLU as the benchmark.
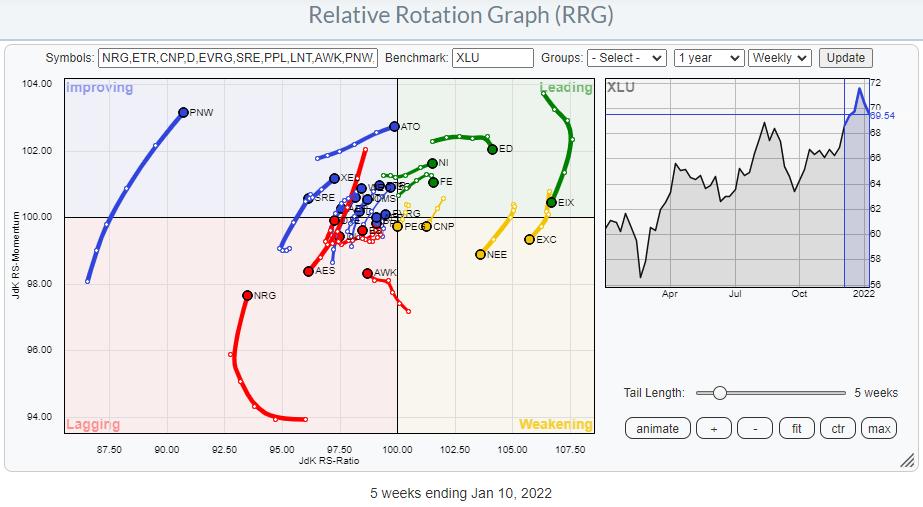
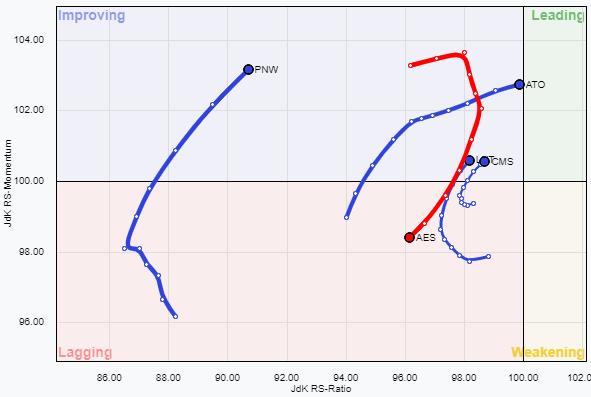 On this image, there are a few tails that draw attention. Clearly visible are PNW and ATO inside the improving quadrant at high JdK RS-Ratio levels and strong RRG-Headings. Here also, AES pops out and is now better visible, as it is moving away from the cluster of tails and heading deeper into the lagging quadrant.
While working through all tails, I also found CMS and LNT as potentially interesting stocks.
AES
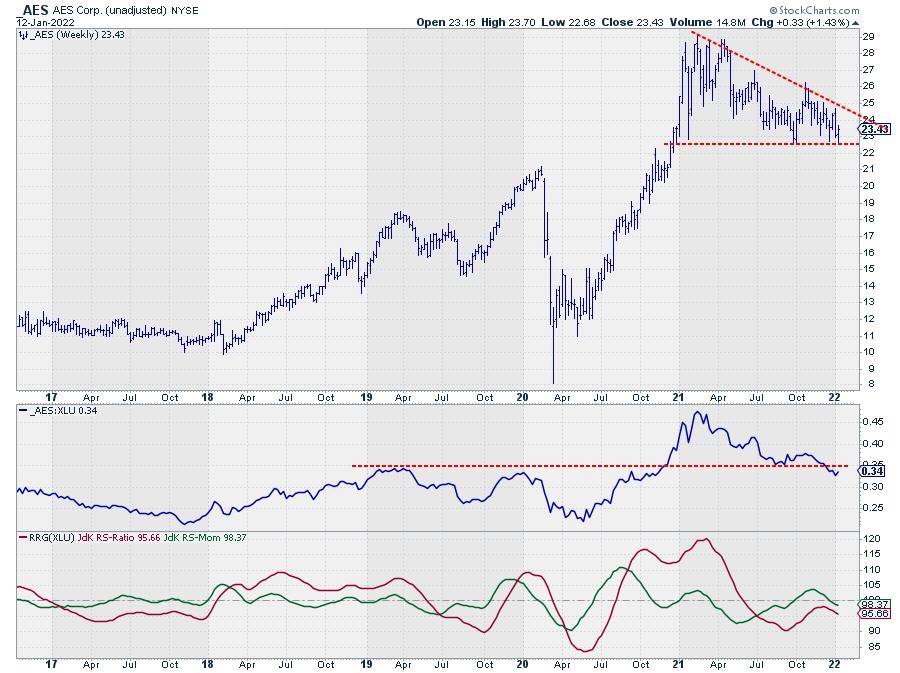
The one and only stock inside the utilities universe that stands out negatively is AES. The RS line has just breached a horizontal support level and continued moving lower. This has caused the RRG lines to roll over again while JdK RS-Ratio had not managed to move above 100. This made the tail rotate back towards and into lagging from improving without reaching the leading quadrant. A very weak rotational pattern, as we know.
On the price chart, there is important support around 22.50. With the major price peaks since the highs in February 2021 all coming in at lower levels, there is clearly downward pressure for this stock.
Once 22.50 gives way, an acceleration lower may be expected.
PNW
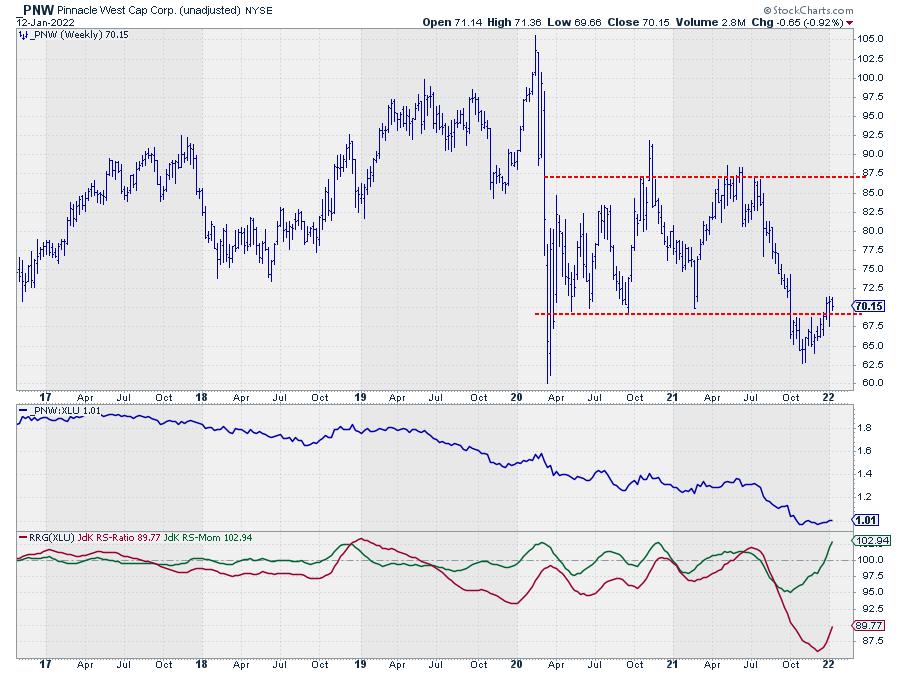
PNW's tail is inside the improving quadrant, but at a strong heading and good length, which indicates that there is power behind the move. The break back into the range on the price chart is a strong sign from a price perspective and supports a further improvement of relative strength. Back in the range, there is now plenty of upside for PNW.
ATO
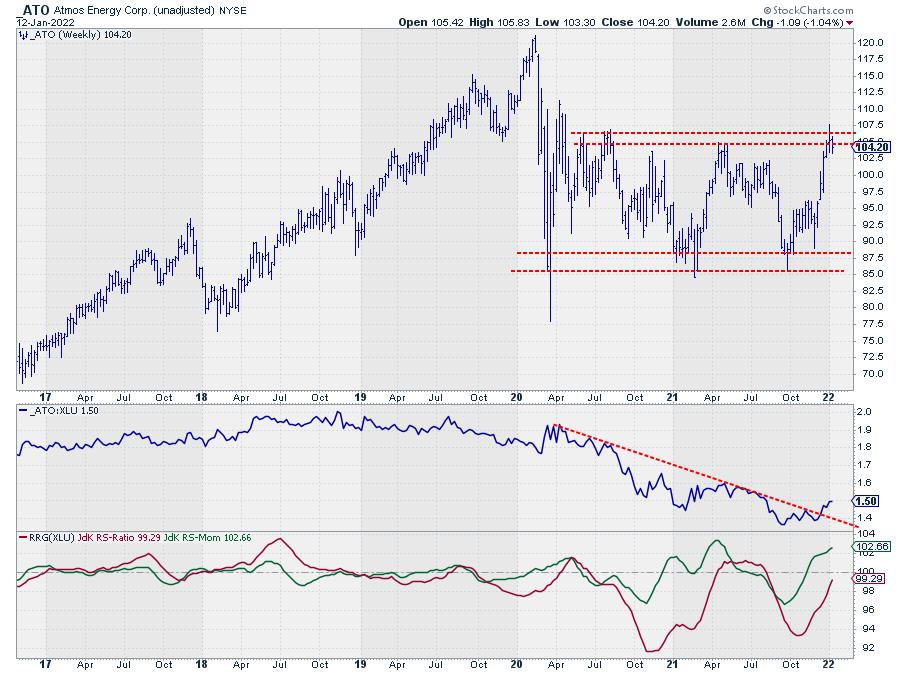
ATO is ahead of PNW both in terms of price and relative strength.
On the RS chart, ATO has bottomed out and started a new uptrend. On the price chart, the price is pushing against the upper boundary of the range between 105-107. Once this hurdle can be cleared, there is upside potential all the way up to the previous peak at 120.
LNT
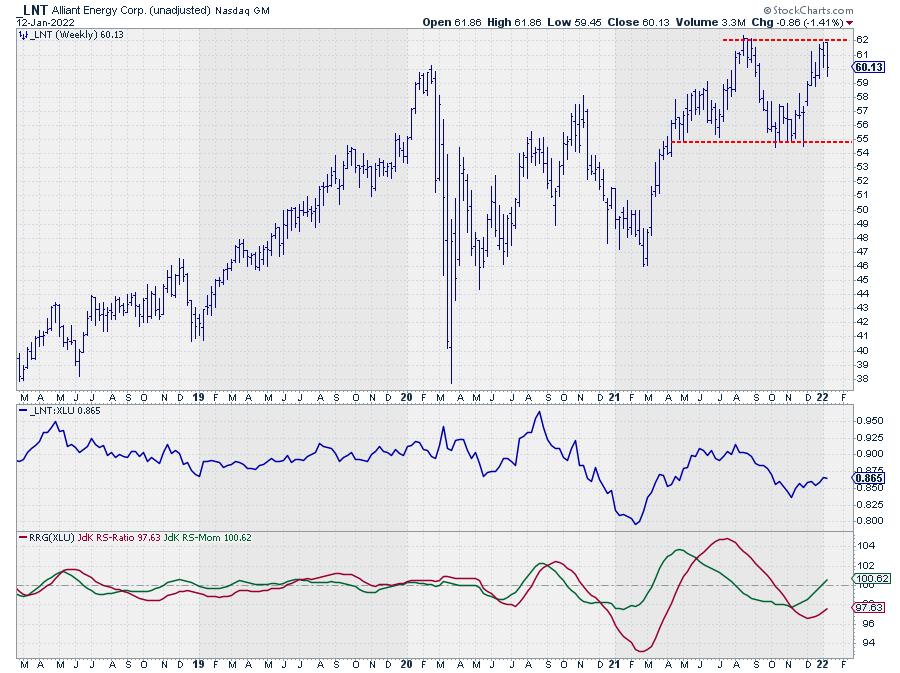
For about 2.5 years (2018 to mid-2020), LNT moved in line with the sector index (RS-line sideways and RRG-Lines oscillating close to 100-level). From mid-2020 onwards, relative strength started to show some big swings.
After a move down, RS for LNT vs XLU has started to move up again, which is pulling the RRG-Lines higher. The JdK RS-Momentum line is already above 100, which positions the tail inside the improving quadrant and points NE towards the leading quadrant.
The trigger for further (relative) strength needs to come from the price chart, where LNT is pushing against resistance coming off its previous high. Taking out 62 to the upside will most likely be the catalyst and push both price and relative strength higher.
CMS
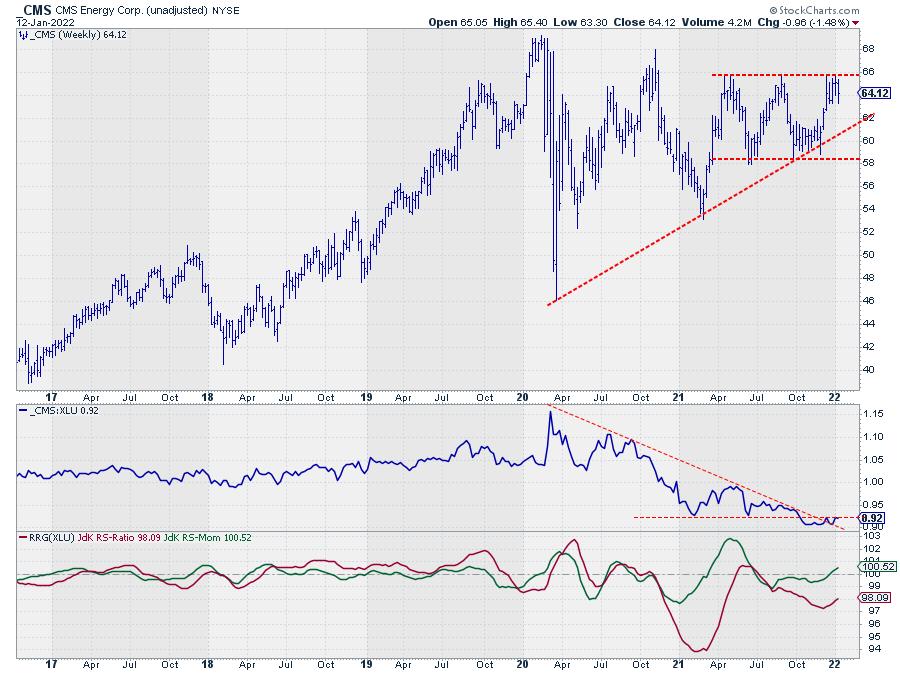
On the price chart, CMS is trading against resistance at the top of its range near 66. The trigger for a further move higher will be a break of that resistance level.
From a relative perspective, the downside momentum that characterized this stock since early 2020 has slowed down. The falling resistance over the relative peaks since 2020 is broken, which is a first positive sign. At the moment, RS is pushing against horizontal resistance, which previously acted as support based on the 2021 lows.
When RS can manage to get back above that level, more relative upside will be unlocked. An upward break in price will certainly be helpful for this.
#StaySafe --Julius
Julius de Kempenaer
Senior Technical Analyst, StockCharts.com
Creator, Relative Rotation Graphs
Founder, RRG Research
Host of: Sector Spotlight
Please find my handles for social media channels under the Bio below.
Feedback, comments or questions are welcome at Juliusdk@stockcharts.com. I cannot promise to respond to each and every message, but I will certainly read them and, where reasonably possible, use the feedback and comments or answer questions.
To discuss RRG with me on S.C.A.N., tag me using the handle Julius_RRG.
RRG, Relative Rotation Graphs, JdK RS-Ratio, and JdK RS-Momentum are registered trademarks of RRG Research.


