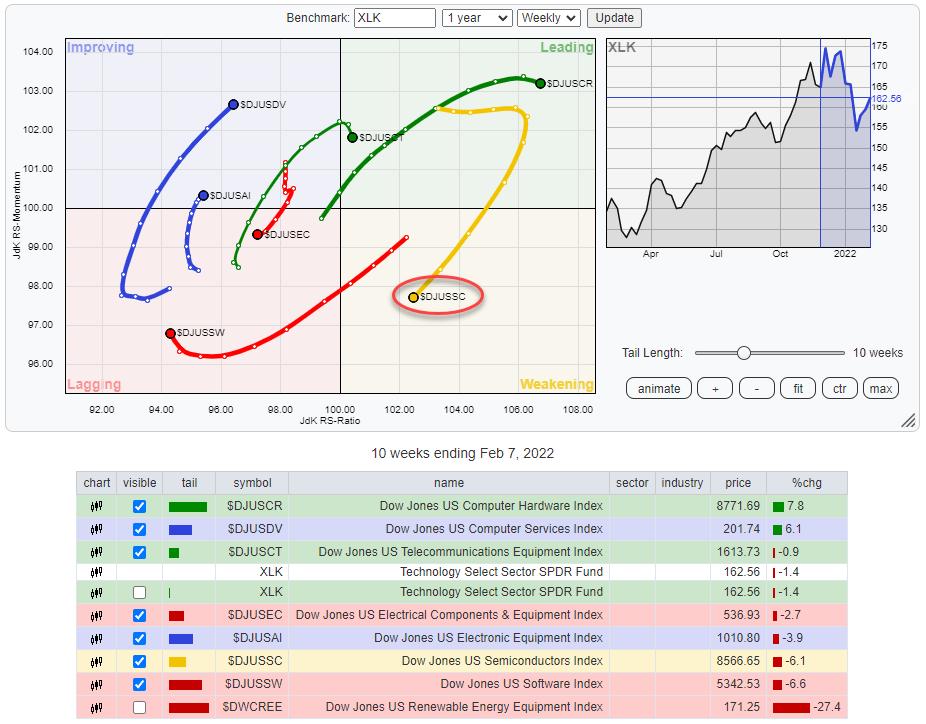
The Technology sector is under pressure for a few weeks already. We have seen a few attempts to bounce back but, so far, these have not been very successful.
The Relative Rotation Graph above shows the groups within the technology sector. The Semiconductors group was a major contributor on the way up, but the tail has rolled over and is now inside the weakening quadrant, moving towards lagging at a negative RRG-Heading.
Checking the other tails on the image shows that there are only two that are at a positive heading; Computer Services ($DJUSDV) and Electronic Equipment ($DJUSAI). However, both are inside the improving quadrant and have quite a distance to travel before they will be hitting the leading quadrant. The charts for these two groups are printed below.
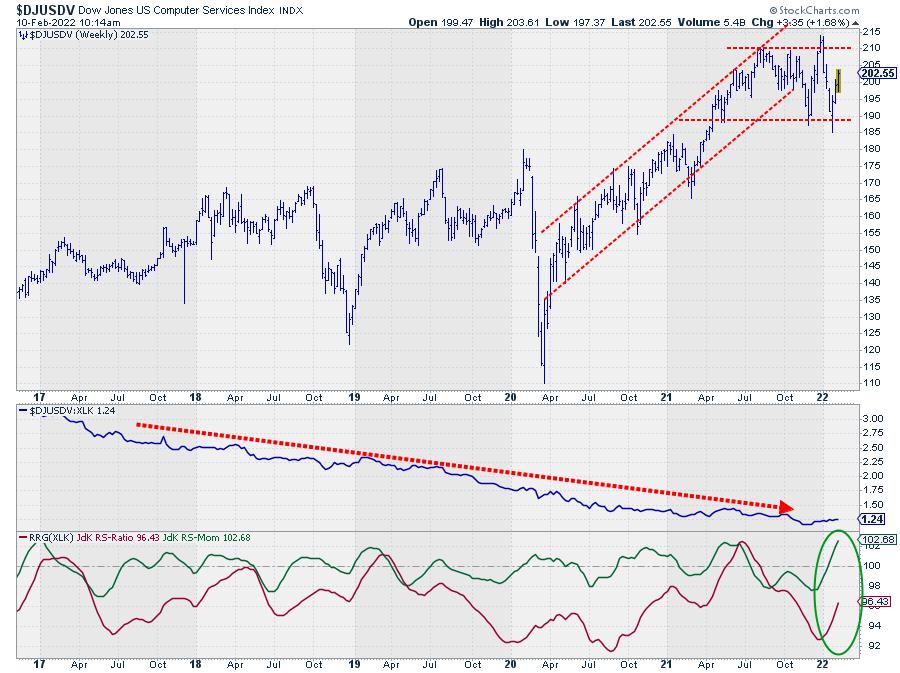
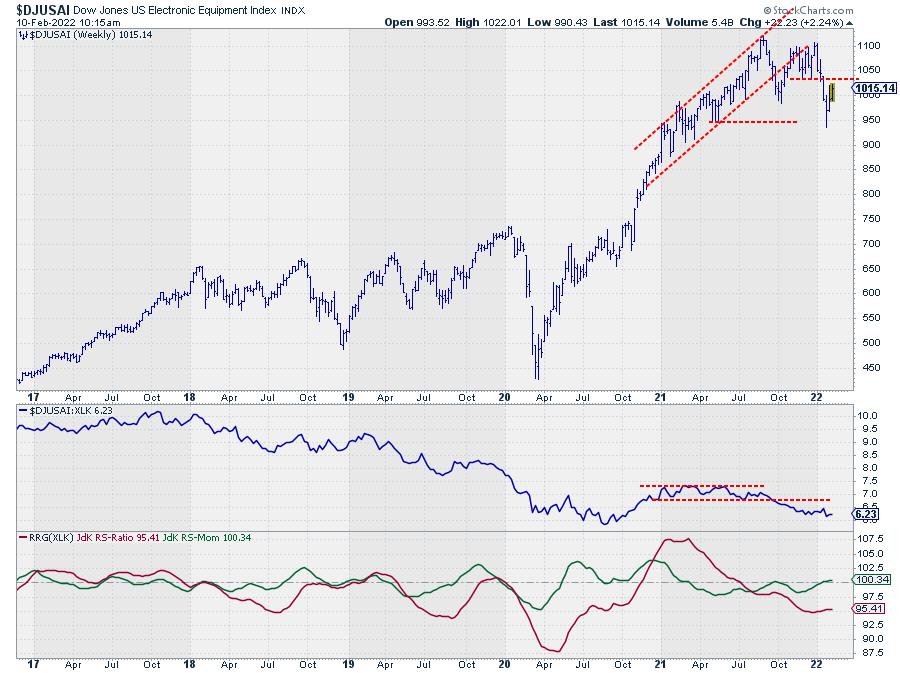
Looking at both price charts makes me go "Mmmmm". Price trends are broken, $DJUSAI already started lower highs and lower lows. Long-term trends in RS are clearly down.... the only reason their RRG tails are "somewhat ok" is because these groups are in what seems to be a short pause in the downtrend.
And think about it... These are the GOOD groups...
Semiconductors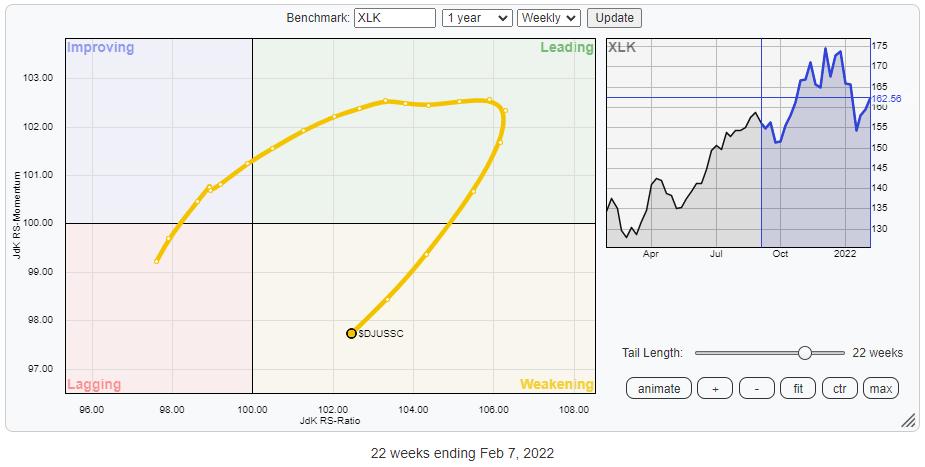
The tail for the group semiconductors rolled over 5/6 weeks ago while it was still inside the leading quadrant. Since then, the semis lost 8.1% against -6.5% for the sector (XLK). Over these weeks the RRG-Velocity (the distance between the week-to-week observations) started to increase, indicating that more power came behind this move.
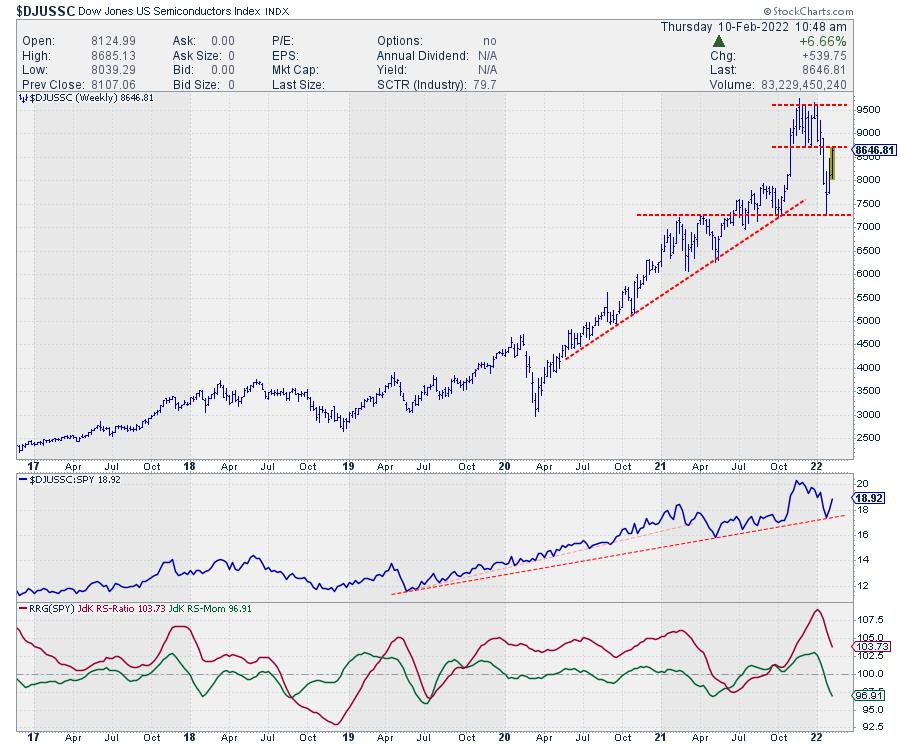
When we bring in the price chart for semiconductors, we see a very clear completed double top formation, followed by a rapid decline to the 7250 area after the completion. From that support area, the market started to bounce back and is now close to its former breakout level, near 8700, again. This is obviously going to be an important level and a test or validation of the double top and its expected consequences.
The cleanest scenario will be when semis don't pass 8700 on the upside and start forming a new lower high around current levels, followed by another dip to 7250 and possibly lower. When 8700 is passed to the upside, the situation gets a little messier. There will still be the possibility to put in a lower high, but the message will be less strong.
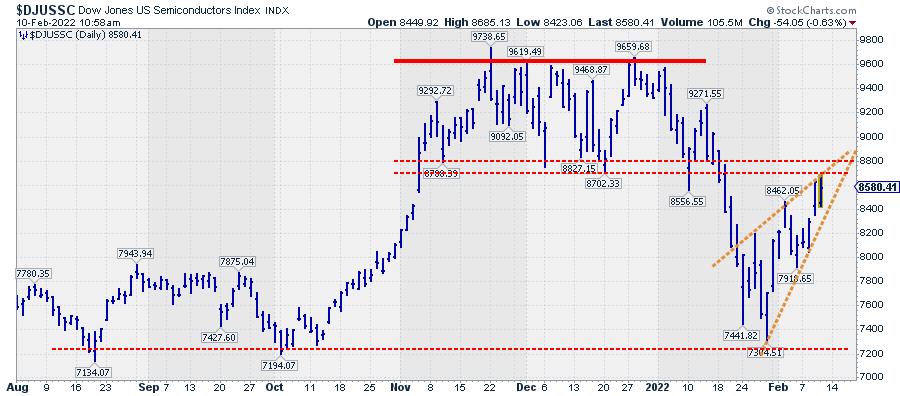
Zooming in on the daily chart shows the price action in more detail and how $DJUSSC is starting to struggle with that overhead resistance area. It also reveals that resistance is probably better marked as a range between 8700-8800.
Another interesting development that I am watching is the possible formation of a rising wedge during the bounce off of support. Completing this wedge downward will certainly add fuel for the scenario of a further decline in this group.
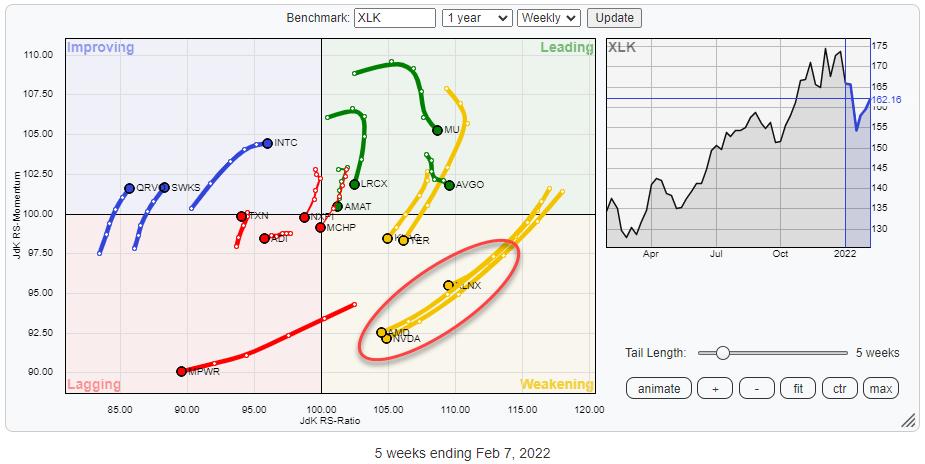
Finally, the RRG above shows the rotation for the individual stocks inside the semiconductors group against XLK. There are only a few tails that are traveling at a positive RRG-Heading and they are all inside the improving quadrant, but still pretty far away from crossing over into leading.
INTC is still at a positive heading but, as you can see already, lost relative momentum over the last three weeks while RRG-velocity is declining.
The most important message on this RRG is coming from the circled cluster inside the weakening quadrant. AMD and NVDA, two of the largest stocks in the group, are leading the charge lower, followed by XLNX, at long tails compared to the other stocks in the group.
All in all, semiconductors are looking weak inside technology, which in itself is already a weakening sector compared to the S&P 500. Caution is required.
#StaySafe, --Julius
Julius de Kempenaer
Senior Technical Analyst, StockCharts.com
Creator, Relative Rotation Graphs
Founder, RRG Research
Host of: Sector Spotlight
Please find my handles for social media channels under the Bio below.
Feedback, comments or questions are welcome at Juliusdk@stockcharts.com. I cannot promise to respond to each and every message, but I will certainly read them and, where reasonably possible, use the feedback and comments or answer questions.
To discuss RRG with me on S.C.A.N., tag me using the handle Julius_RRG.
RRG, Relative Rotation Graphs, JdK RS-Ratio, and JdK RS-Momentum are registered trademarks of RRG Research.


