Yesterday (Wed 3/9), the S&P bounced up around 2.5%... And although it is a nice jump after all the declines we have seen recently, it doesn't impress me much. At least not enough to get very bullish again all of a sudden.
Of course, a 2.5% bounce in one day is nice, and maybe there will be a bit more follow-through. But does that change the current picture in terms of trends and (sector) rotations?
I think not ... Not yet, at least.
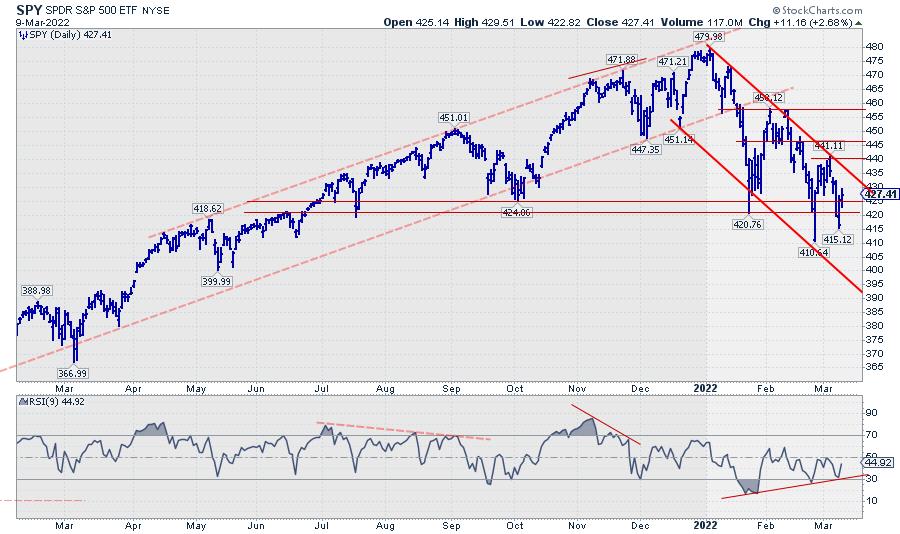
The daily chart for SPY is still in a rhythm of lower highs and lower lows within the boundaries of a descending channel that is getting more pronounced. As long as that remains intact, the trend for SPY remains down. Given the fact that the channel is wide and markets are very volatile, significant jumps can be seen on a day-to-day basis, but don't let them fool you into thinking the trend has all of a sudden changed.
Under the surface, the RSI is showing a positive divergence on a daily basis, which can possibly pause the decline for a bit. But a divergence alone and in itself is not enough to "make a call" for a turnaround. At least not for me. When SPY can break from that descending channel and start putting in higher highs/lows or a bottom reversal formation, I will reconsider.
Sector Rotation on Weekly RRG
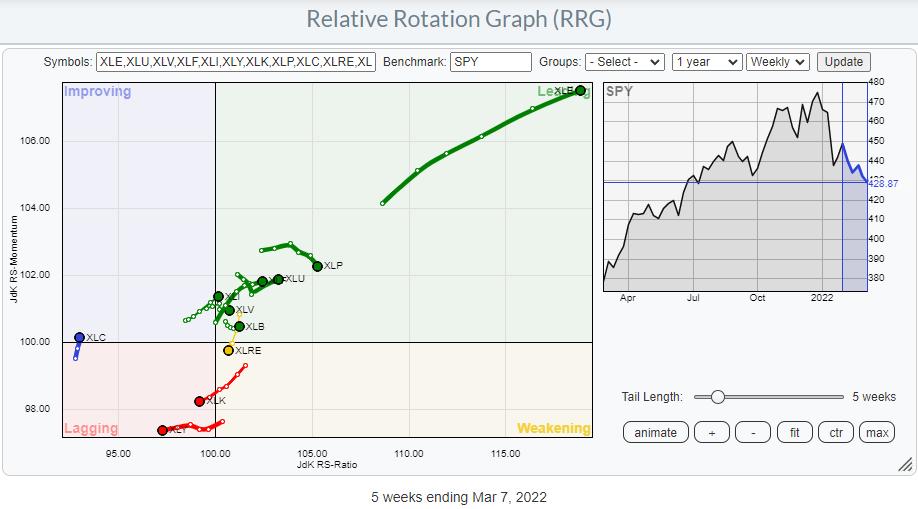
The weekly RRG has not much changed so far. The rotational trends are still quite clear.
The most important thing is the rotation for both the Technology and the Consumer Discretionary sectors into the lagging quadrant. Having these two heavyweights (40% of market cap in S&P 500) pushing into the lagging quadrant will automatically force smaller sectors in the opposite direction.
The other very clear trend is for the Energy sector. The XLE tail is almost literally "flying off the charts".
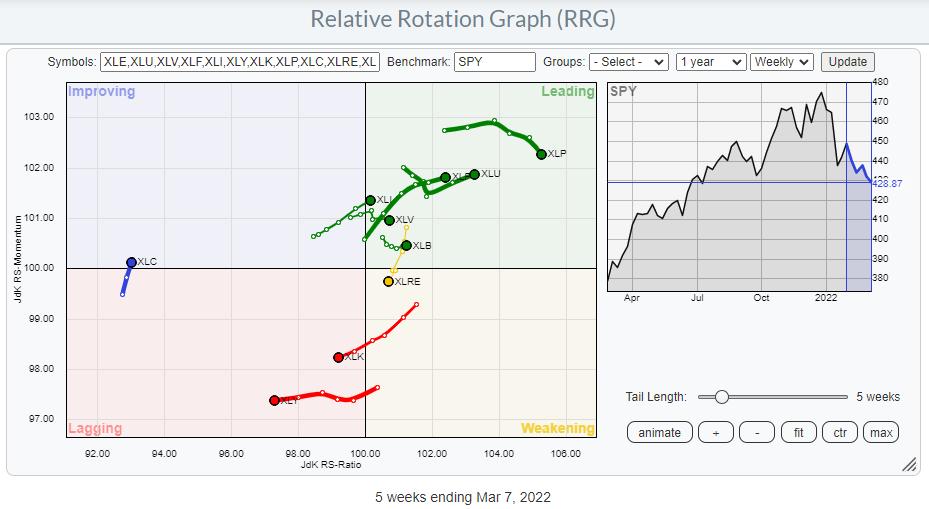
When I take the XLE tail off the RRG, the other rotations become better visible. XLC is crossing over into the improving quadrant, but the sector is still very much disconnected from the rest of the universe with that very low JdK RS-Ratio reading. It will take a lot of upward price and relative movement before XLC can return to(wards) leading.
XLRE has just rotated into the weakening quadrant from leading, making the sector vulnerable to further underperformance.
Inside the leading quadrant, most of the sectors are also at a positive RRG-Heading. XLP has started to slow down on the JdK RS-Momentum scale, but is still picking up relative strength and is the second-strongest sector after Energy on this scale.
XLU hooked back up a few weeks ago and is now back at a strong RRG-Heading, as it is pushing further into leading while XLI is just now crossing over into leading at a strong heading, making it a sector with good perspectives for coming weeks.
Industrials (XLI)
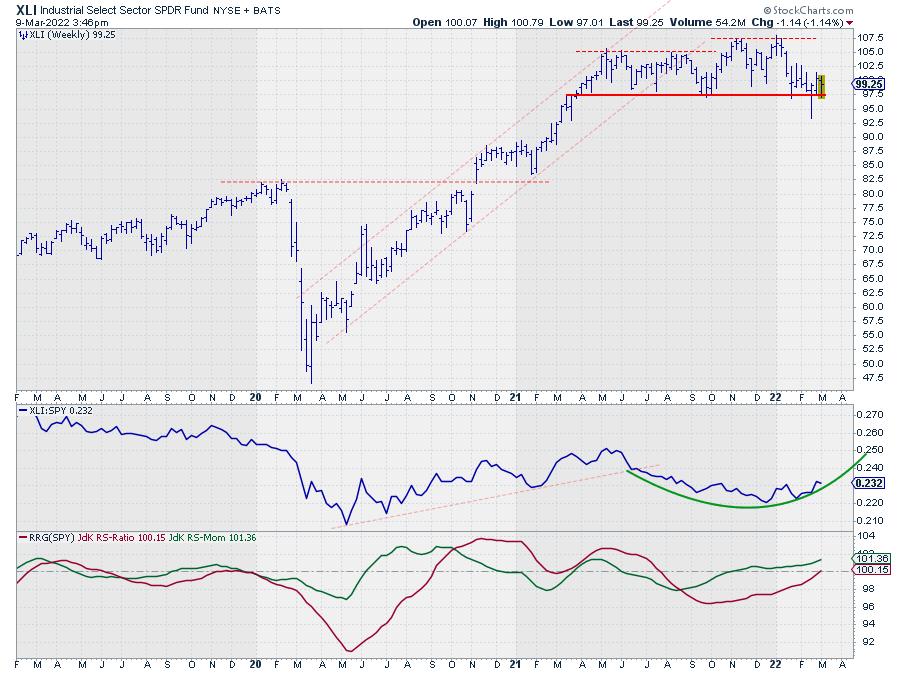
XLI is holding up very well at the lower boundary of its trading range. With the S&P dropping, that is resulting in a strong relative strength. This week that is resulting in a crossover of the RS-Ratio line above 100, pushing the tail into the leading quadrant.
Within that range, a rally towards 107.50 is very well possible. 97.50 remains support on the downside.
Utilities (XLU)
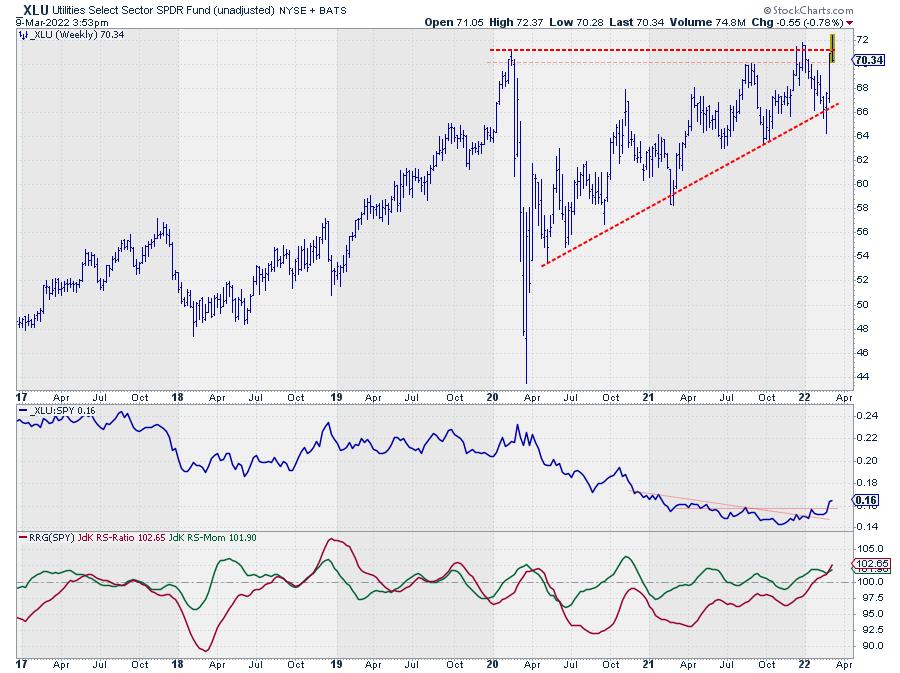
XLU is trying to break higher and take out its overhead resistance around 71-72. Once such a break can be established, much more upside will become available.
From a relative point of view, things are continuing to improve. The bottoming process in the RS-Line has now been completed and more relative strength is expected in the coming weeks. The RRG-Lines are both well above the 100-level and pushing higher, which sends the tail further into the leading quadrant.
#StaySafe, --Julius
Julius de Kempenaer
Senior Technical Analyst, StockCharts.com
Creator, Relative Rotation Graphs
Founder, RRG Research
Host of: Sector Spotlight
Please find my handles for social media channels under the Bio below.
Feedback, comments or questions are welcome at Juliusdk@stockcharts.com. I cannot promise to respond to each and every message, but I will certainly read them and, where reasonably possible, use the feedback and comments or answer questions.
To discuss RRG with me on S.C.A.N., tag me using the handle Julius_RRG.
RRG, Relative Rotation Graphs, JdK RS-Ratio, and JdK RS-Momentum are registered trademarks of RRG Research.


