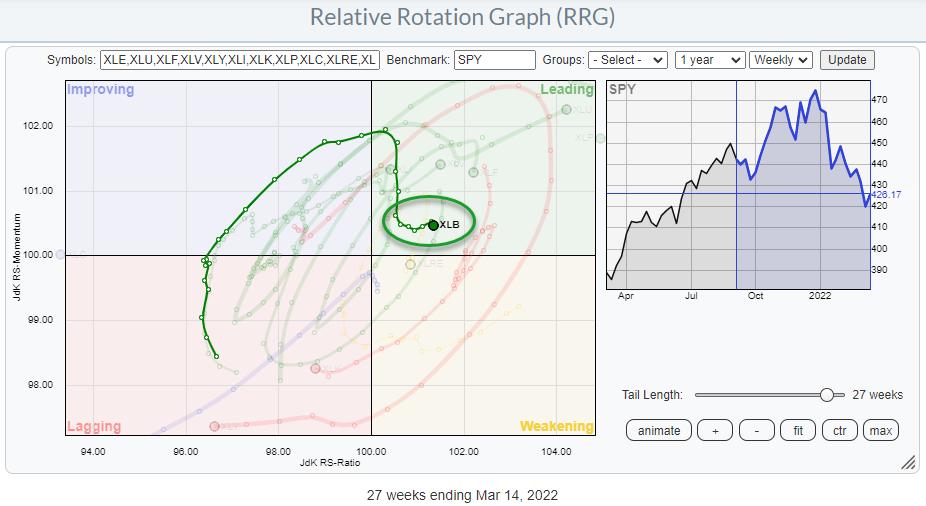
The materials sector has recently started to pick up relative strength again following a loss of relative momentum while inside the leading quadrant. The RRG above, with the XLB tail highlighted, is a nice example of how RRG-Velocity, which measures the week-to-week distances on the tail, started to shrink before turning. A declining RRG-Velocity is often seen before a tail starts to turn.
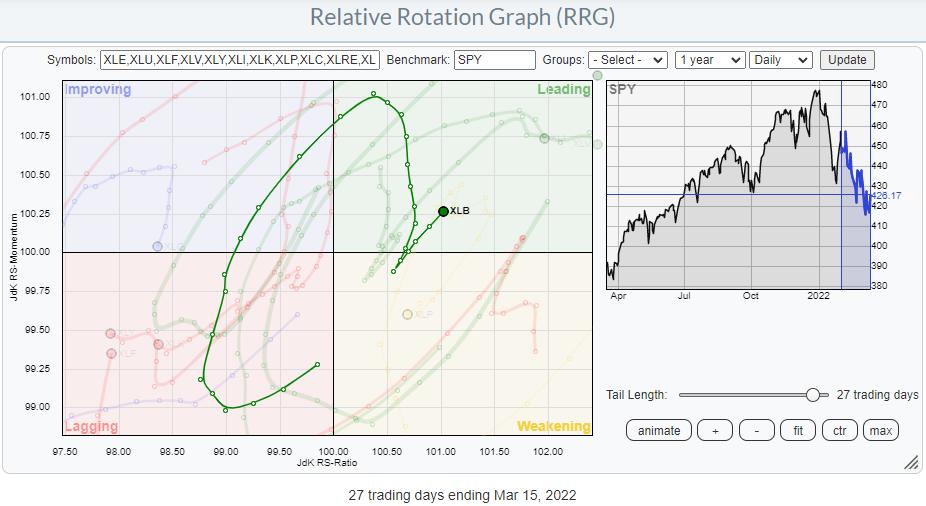
The second RRG shows the daily rotation; we can see that a very rapid clockwise rotation took place starting five days ago after dipping into the weakening quadrant, shooting the XLB tail back into leading at a strong RRG-Heading. This combination of rotations makes the materials sector worth further investigation.
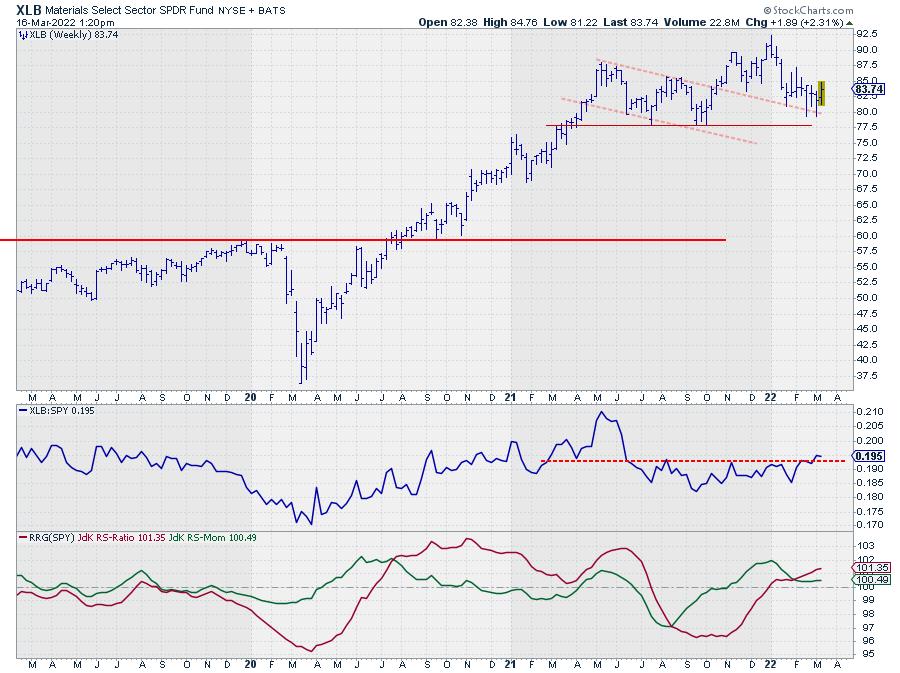
The chart above comes from the list that I always use in Sector Spotlight. As I mentioned in the show on Tuesday (March 15), the break of the RS-Line above that horizontal resistance level is interesting to watch. It is the cause of the quick rotation back up on the daily RRG, but it also frees up the way for more relative improvement, as the overhead barrier is now gone. This outlook is backed by the fact that the materials sector has been able to hold above its support level and even seems to be putting in a higher low -- a marginal one, but still.
The former peaks around 87.50 and 92.50 are the next intermediate resistance levels to watch on the way up.
Inside the Materials Sector
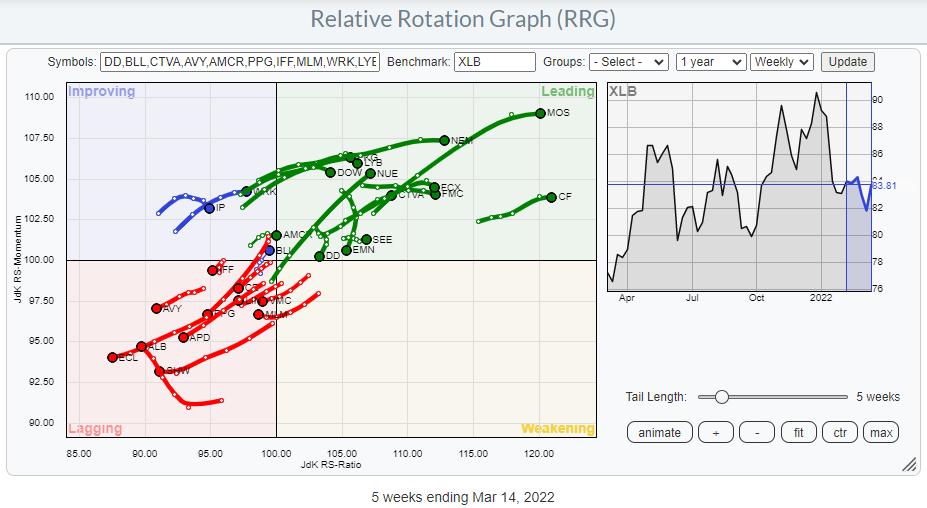
When we go inside the materials sector and bring up the RRG above, which holds all the members of XLB, we see a clear split between two groups of stocks. One group is clearly traveling NE into the leading quadrant, while the other travels in the opposite direction (SW) further into the lagging quadrant.
On the RRG below I have only enabled the tails that are showing a clear direction, either positive or negative. You can check the ticker symbols in the table below.
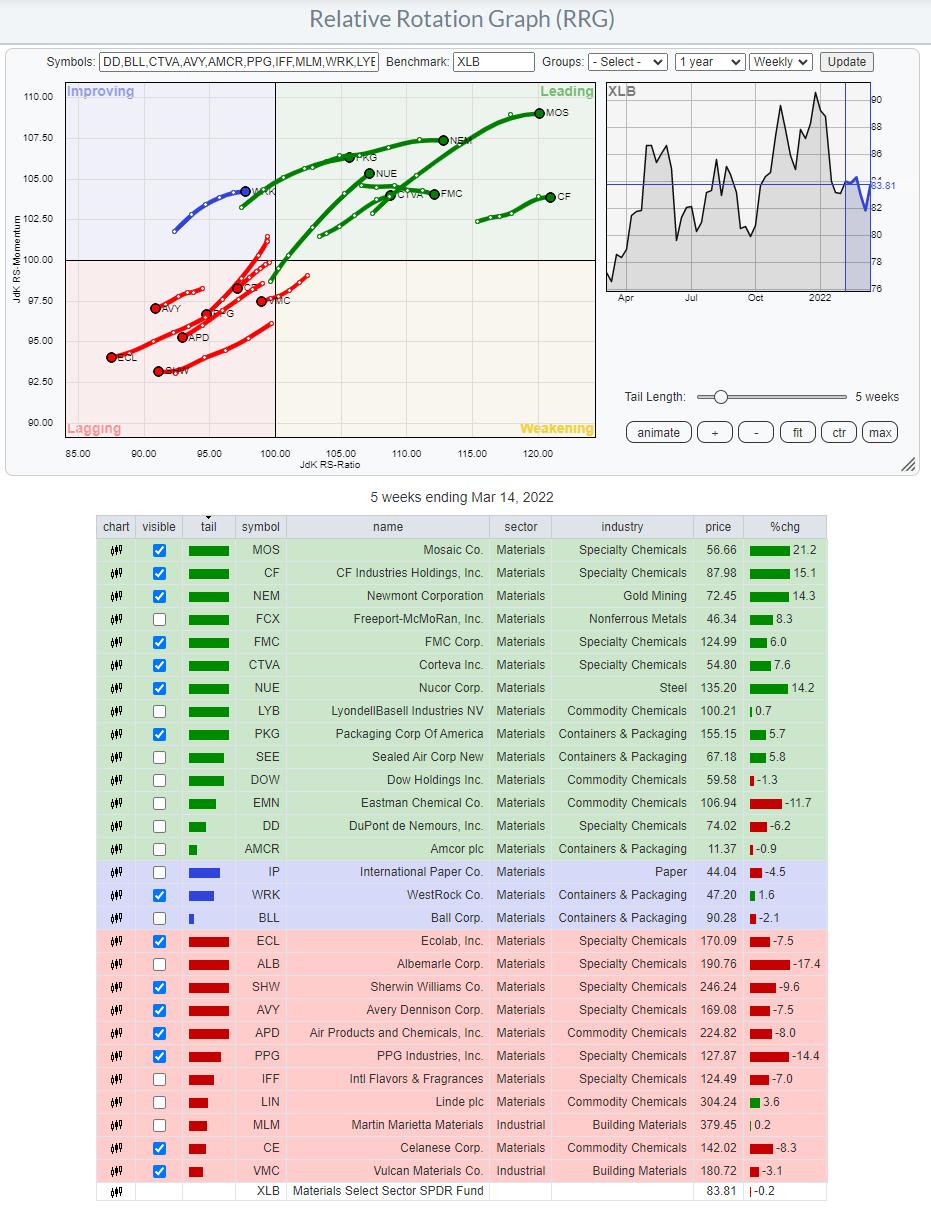
While going over the individual price charts belonging to these tails, I found these two particularly interesting.
Celanese Corp - CE
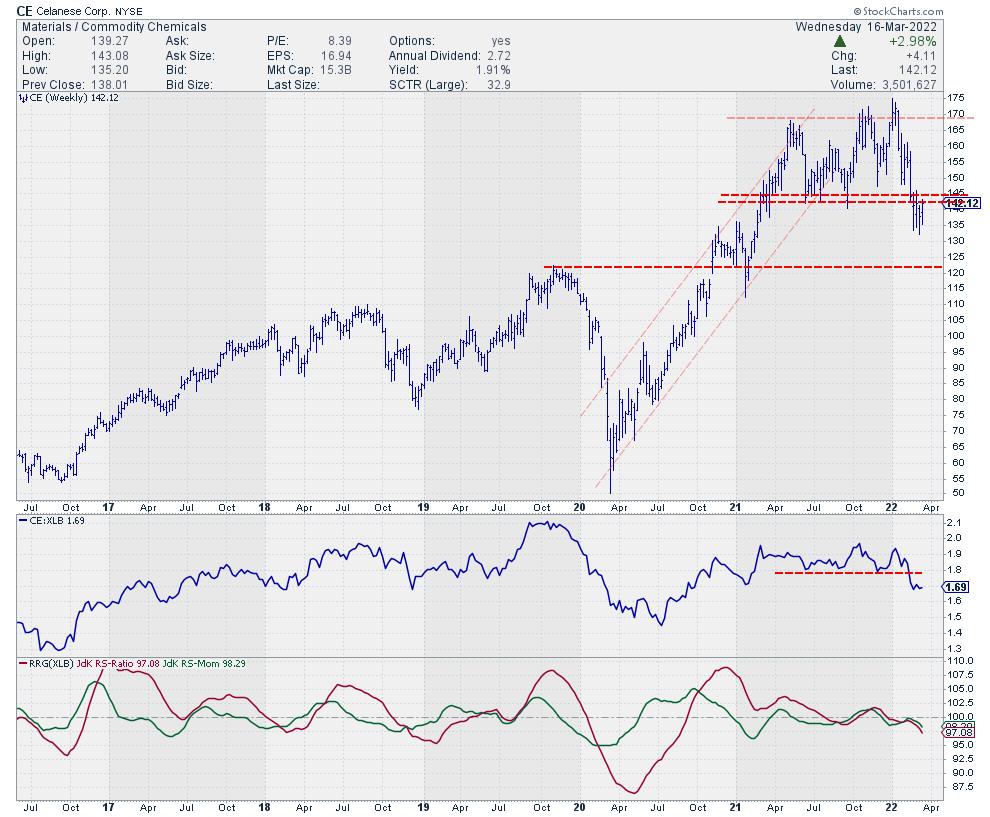
Ce's tail is inside the lagging quadrant and heading lower on both axes. This results in both RRG-Lines moving lower below the 100-level.
The most recent trigger for renewed relative weakness came from the drop below support in the RS-line; the relative weakness is supported by the completion of a big topping formation on the price chart, where the market is working to break below the support area between 140-145.
Within the materials sector, this commodity chemicals stock is better avoided.
Packaging Corp of America = PKG
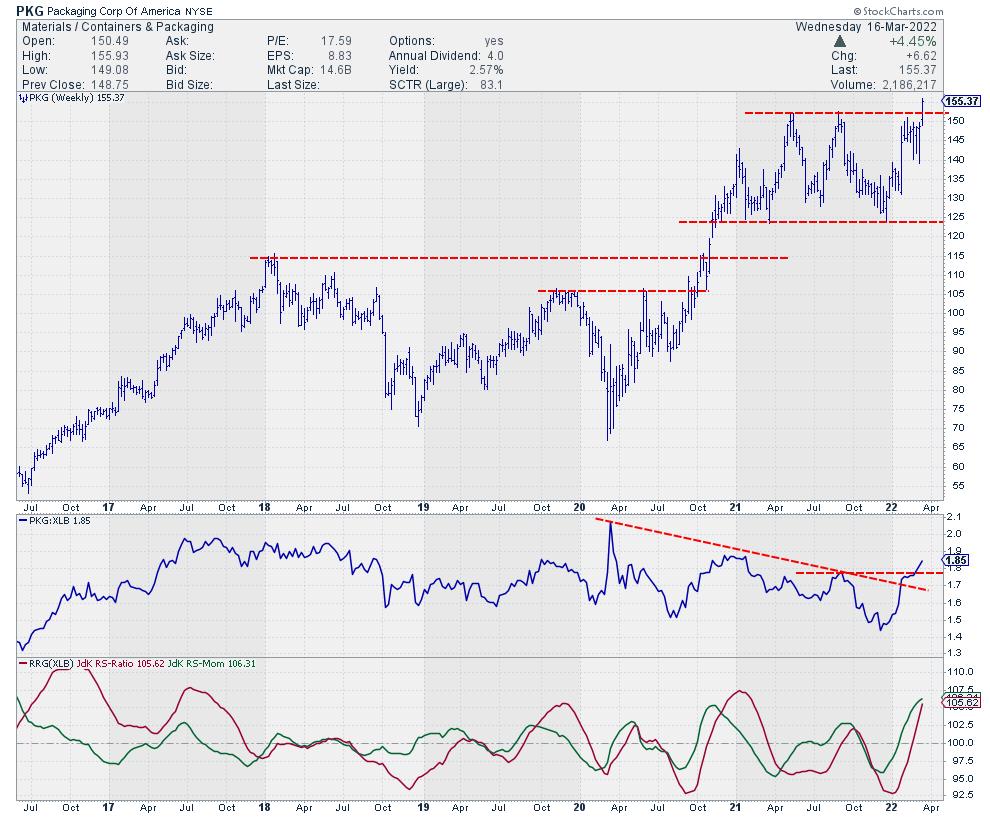
PKG is on an opposite rotational trajectory. Its tail is inside leading and traveling at an RRG-Heading of just over 80 degrees. That means it's picking up relative strength at a stable rate of change (=momentum).
The chart above supports further improvement, both in terms of price as well as relative.
On the price chart, PKG just broke out of a large consolidation that lasted all of 2021. Based on the height of that range, a price target for PKG can be pegged around 175.
RS already started to improve a few weeks ago, but is now certainly getting a boost from the break above resistance on the price chart. These opposite rotations could well be used to set up a pair trade within the materials sector.
#StaySafe, --Julius
Julius de Kempenaer
Senior Technical Analyst, StockCharts.com
Creator, Relative Rotation Graphs
Founder, RRG Research
Host of: Sector Spotlight
Please find my handles for social media channels under the Bio below.
Feedback, comments or questions are welcome at Juliusdk@stockcharts.com. I cannot promise to respond to each and every message, but I will certainly read them and, where reasonably possible, use the feedback and comments or answer questions.
To discuss RRG with me on S.C.A.N., tag me using the handle Julius_RRG.
RRG, Relative Rotation Graphs, JdK RS-Ratio, and JdK RS-Momentum are registered trademarks of RRG Research.


