In this week's episode of Sector Spotlight, I had planned to also do a review of the current growth/value rotation. Due to bad timing on my side, or talking too long on the breakdown of sectors into cyclical, defensive and sensitive in large-cap, equal-weight and small-cap universes, I ran out of time and promised to write up this segment. So here we go.
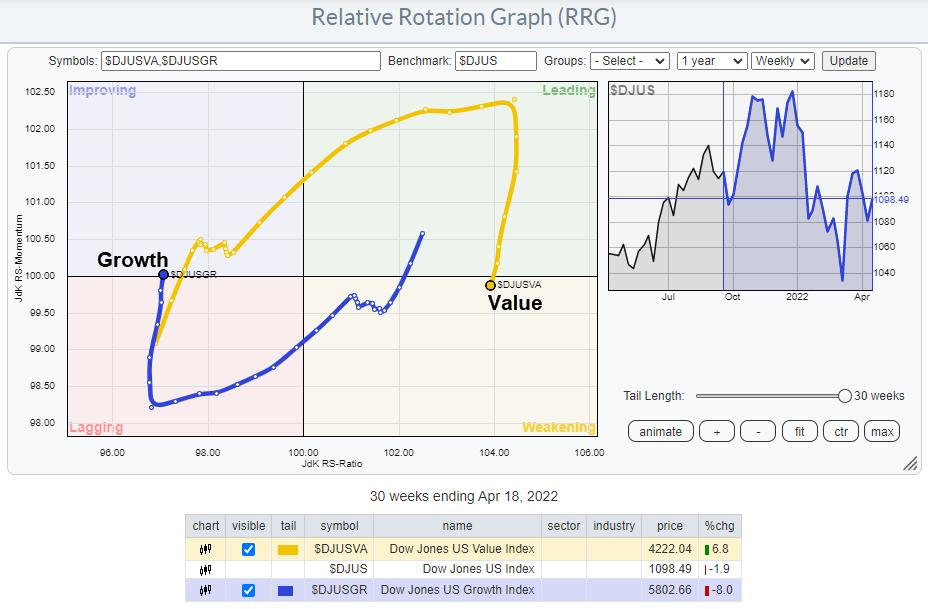
The growth value rotation over a longer period (the RRG above) shows a 30-week tail, clearly in favor of value. The tail for value is solidly on the right-hand side and the performance of $DJUSVA over this period is +6.8%, while growth ($DJUSGR) lost 8% over the same period. Over the last six weeks, the performance for both groups is more in-line and slightly in favor of Growth (+6.9%) vs. Value (5.4%).
The continued strength of Value can be seen on the RRG from the almost vertical move down as opposed to a move lower, where the tail also loses on the JdK RS-Ratio scale. When the tail moves predominantly vertically up or down, it is very often corrective in nature.
A vertical move lower from leading to weakening is often a pause in a relative uptrend. V.v. a vertical move up from lagging into improving is often a recovery within a relative downtrend. Obviously, at some stage, a move on the RS-Ratio scale will have to take place in order to complete the rotation back up or down.
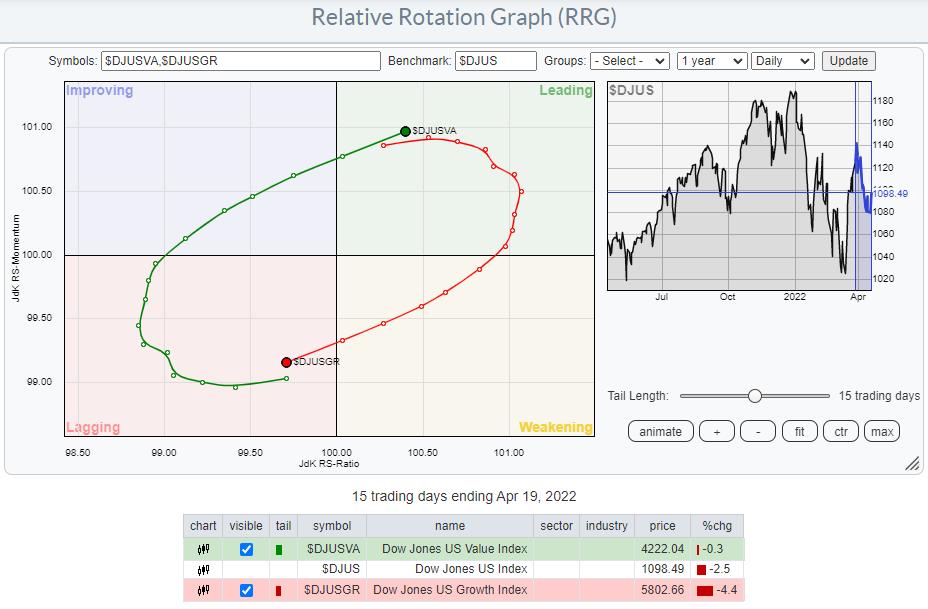
Looking at the daily version of the same RRG, it becomes visible that the improvement of value has already started. Over the last three weeks, the value tail rotated back to leading after a nice gradual trajectory through lagging and improving. Growth obviously took the opposite route.
With the weekly tail far to the right and dipping into the weakening quadrant, it is very well possible/likely that the short-term strength, as seen on this daily RRG, will eventually pull the weekly tail back up and start a new period of strength for value over growth.
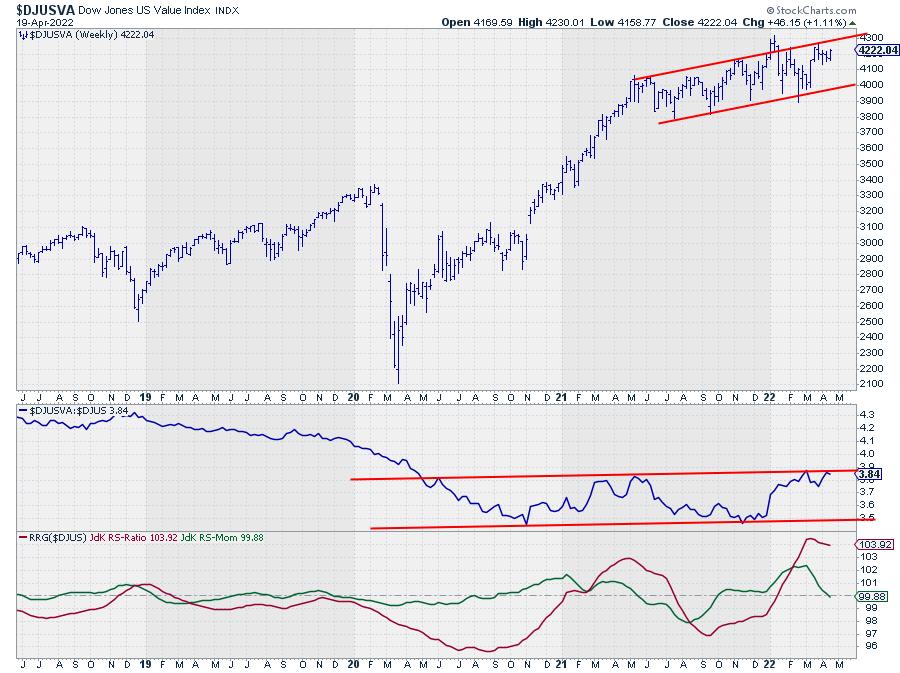
On the price chart, $DJUSVA is pushing against its all-time-high levels around 4300 while moving in a slightly up-sloping range. An upward break out of that range and beyond 4300 will very likely be the catalyst for a further move higher.
Almost similar is the image in the RS-Line, although here the range has started to form after a prolonged period of underperformance for value. When relative strength breaks upward from this range, it completes a very long base, which usually leads to a serious reversal of the trend.
#StaySafe, --Julius
Julius de Kempenaer
Senior Technical Analyst, StockCharts.com
Creator, Relative Rotation Graphs
Founder, RRG Research
Host of: Sector Spotlight
Please find my handles for social media channels under the Bio below.
Feedback, comments or questions are welcome at Juliusdk@stockcharts.com. I cannot promise to respond to each and every message, but I will certainly read them and, where reasonably possible, use the feedback and comments or answer questions.
To discuss RRG with me on S.C.A.N., tag me using the handle Julius_RRG.
RRG, Relative Rotation Graphs, JdK RS-Ratio, and JdK RS-Momentum are registered trademarks of RRG Research.


