With the general market going through a rough time at the moment, it makes sense to see if we can find pockets that are worth watching and potentially holding in portfolios.
For this occasion, I am using the DJ Industrials universe.
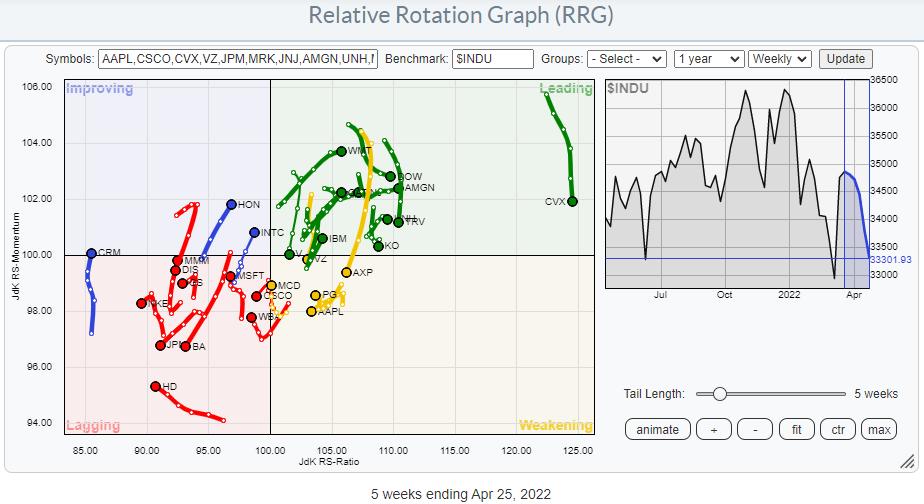
As you know Relative Rotation Graphs are based on a relative strength approach. The center of the chart is the benchmark and the trends are relative trends.
In the chart above we can see an evenly spread out universe around the center of the chart. When stocks are showing up inside the leading quadrant, it does not necessarily mean that they are moving up in price but they are in a rising relative trend.
Looking at the RRG I want to spot the tails that are traveling at a positive RRG-Heading (0-90 degrees).
In the chart below I have deleted all others.
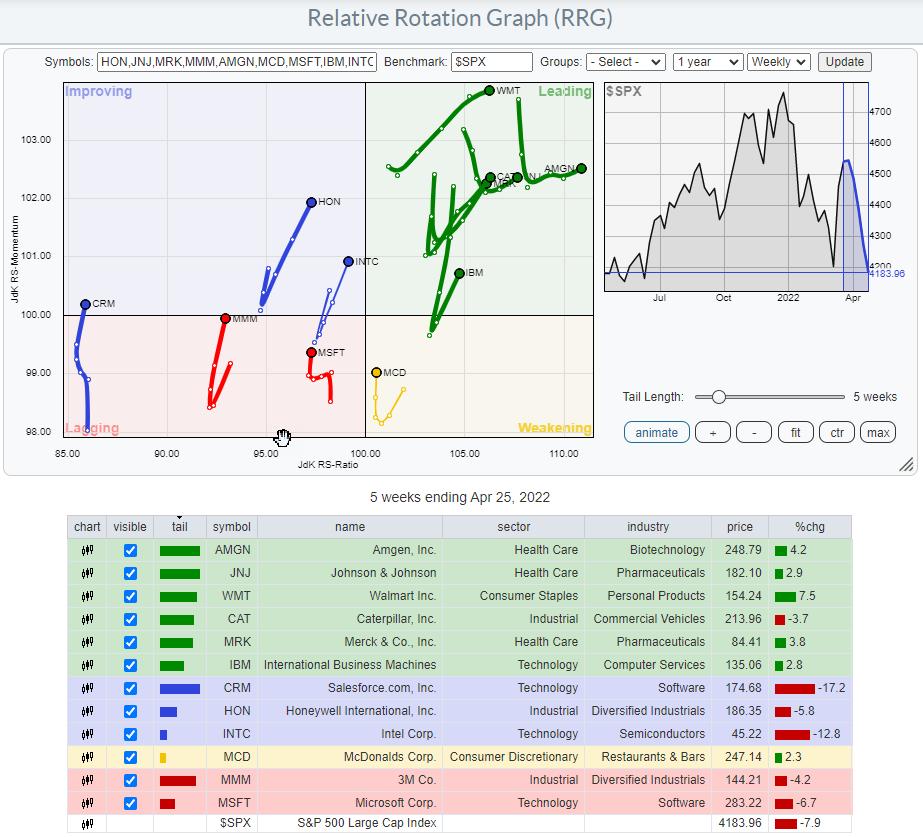
These are the stocks that are either already in a relative uptrend against $INDU or attempting to make their way (the ones on the left-hand side of the graph)
Because most retail investors traders are looking for absolute price performance it is also important to check the price trends as well. The way to do that with RRGs is to change the benchmark to $ONE. Instead of comparing the performance of the stocks on the graph with the benchmark and each other, they are now compared to a benchmark that is always equal to 1, i.e. absolute performance.
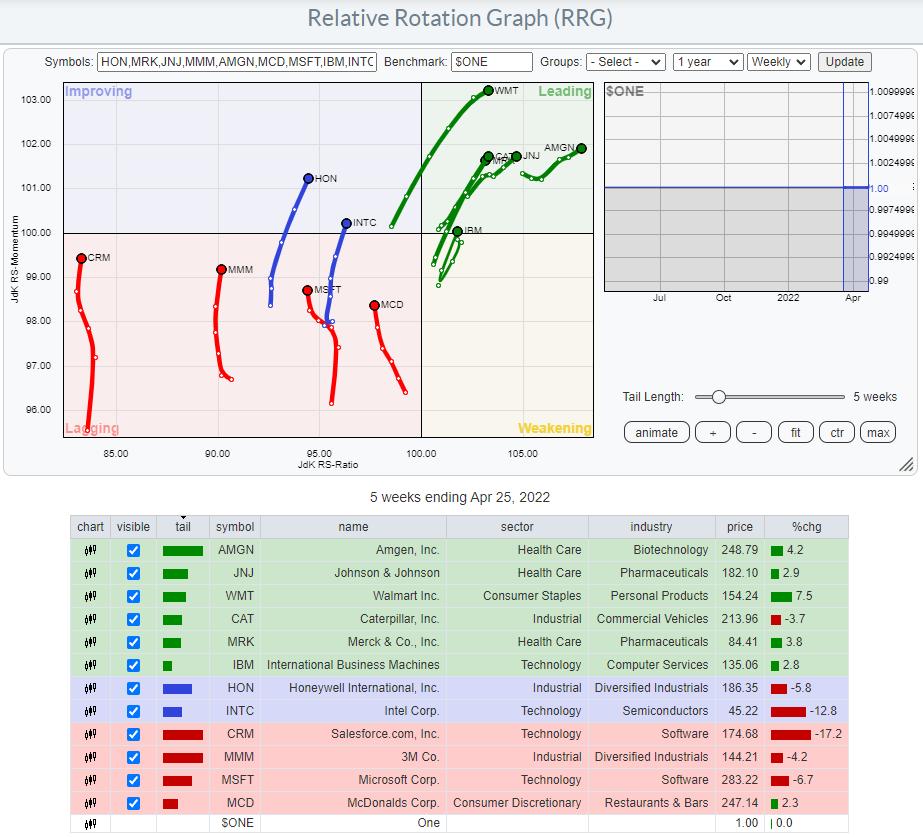
The main difference is that the image has shifted to the left. This is to be expected when the benchmark ($INDU) is going down. The other difference that we can spot on this version of the RRG, is that the tails are less "jiggly", they look cleaner which suggests that some reliable trends are underway, especially for the stocks that are inside the leading quadrant.
Browsing through the price charts for these individual stocks rapidly clarifies why the stocks inside the lagging and improving quadrants are on that side of the graph. They are all still in downtrends but going through a, most likely temporary, recovery which causes their tails to pick up a bit of relative momentum. Their trends have not changed.
That makes them not suitable for our purpose today.
The next RRG shows only the tails of the stocks inside the leading quadrant.
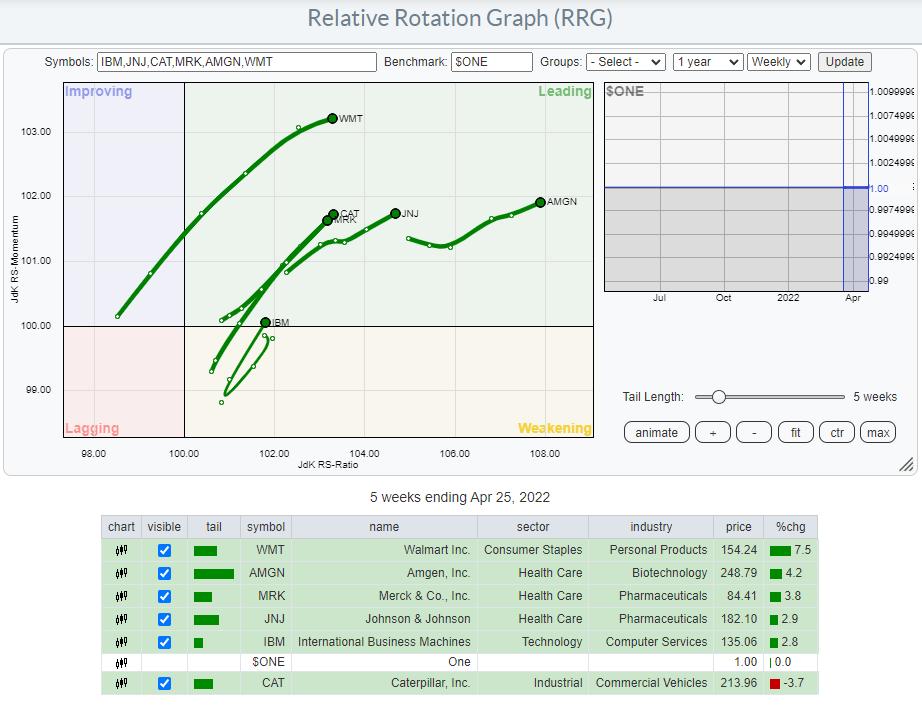
At the moment these names are all potential targets. Now it comes down to the individual charts.
I will show the ones that I like best below.
Johnson&Johnson - JNJ
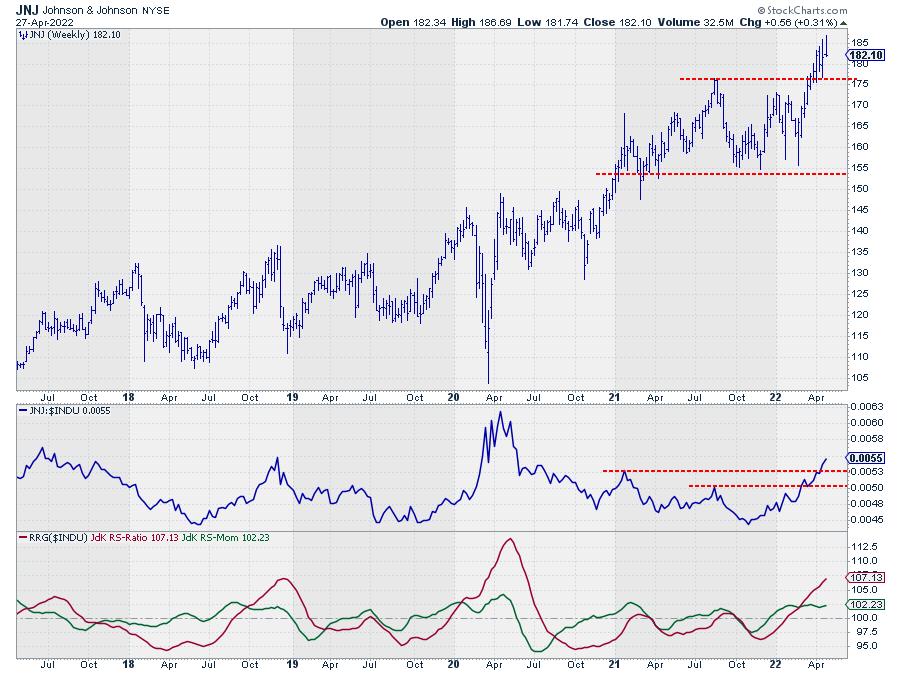
JNJ is showing strong breakouts in both price and relative terms. Taking out resistance around $175 and managing to stay above that level for weeks already despite weakening market conditions is a sure sign of strength.
The upward break in relative strength marks the turnaround after a two year (almost) period of weak and/or sideways movement against $INDU.
Merck - MRK
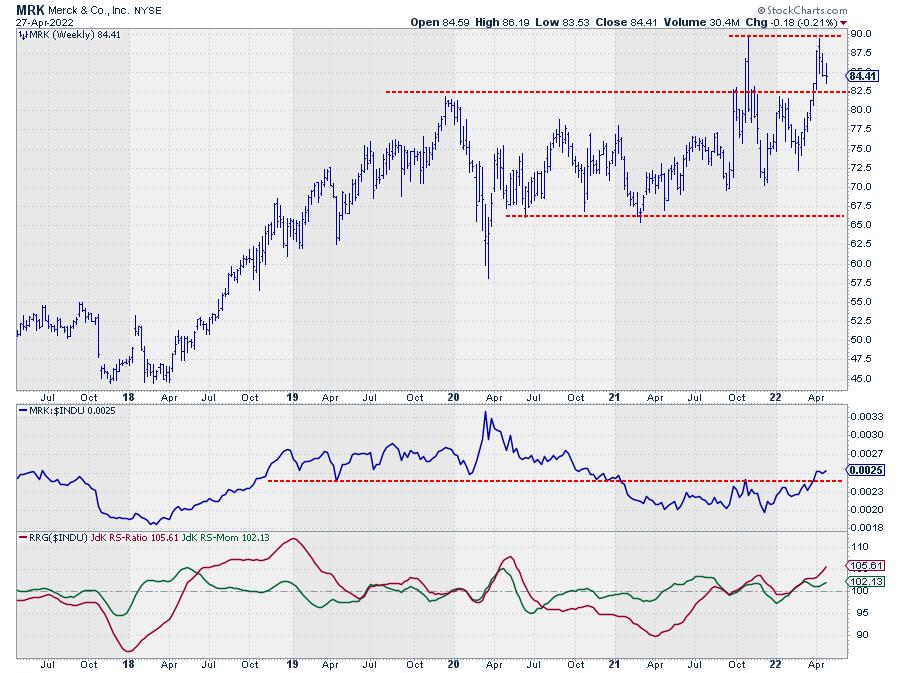
MRK is showing a picture that is quite similar to JNJ. The only difference is the big upward spike at the end of last year. The most important resistance level, IMHO, was the area around 82.50. Once broken a few weeks ago MRK rallied to the peak level of last year (89.74 vs 89.48) and seems to be underway for a test of, now, support at 82.50. Once a bottom can be put into place here MRK becomes an interesting stock for a rally back to $ 90 and possibly beyond.
Relative strength is certainly supportive.
Wallmart - WMT
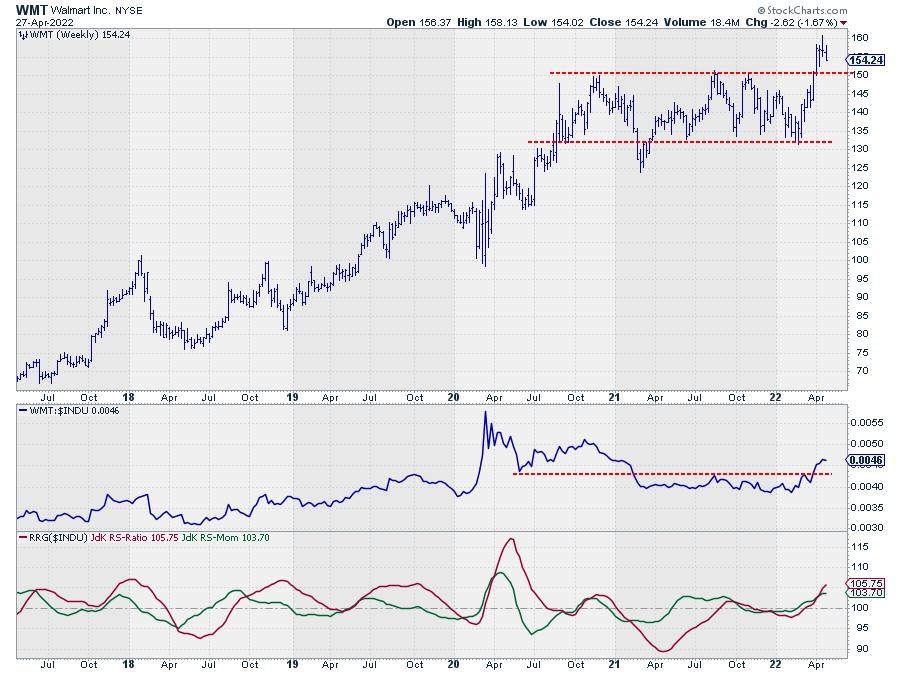
The third one on the list, and probably the "cleanest"chart is Wallmart.
The range in price between 130-150 is clearly visible and came into place when the downward break was reversed and WMT moved (back) into that range. Four weeks ago WMT broke above the upper boundary of that range and is still holding above that level (150) which should now start to act as support.
Here also a new low at or above support will make WMT a strong contender for inclusion in portfolios backed by strong relative strength.
#StaySafe, --Julius
Julius de Kempenaer
Senior Technical Analyst, StockCharts.com
Creator, Relative Rotation Graphs
Founder, RRG Research
Host of: Sector Spotlight
Please find my handles for social media channels under the Bio below.
Feedback, comments or questions are welcome at Juliusdk@stockcharts.com. I cannot promise to respond to each and every message, but I will certainly read them and, where reasonably possible, use the feedback and comments or answer questions.
To discuss RRG with me on S.C.A.N., tag me using the handle Julius_RRG.
RRG, Relative Rotation Graphs, JdK RS-Ratio, and JdK RS-Momentum are registered trademarks of RRG Research.


