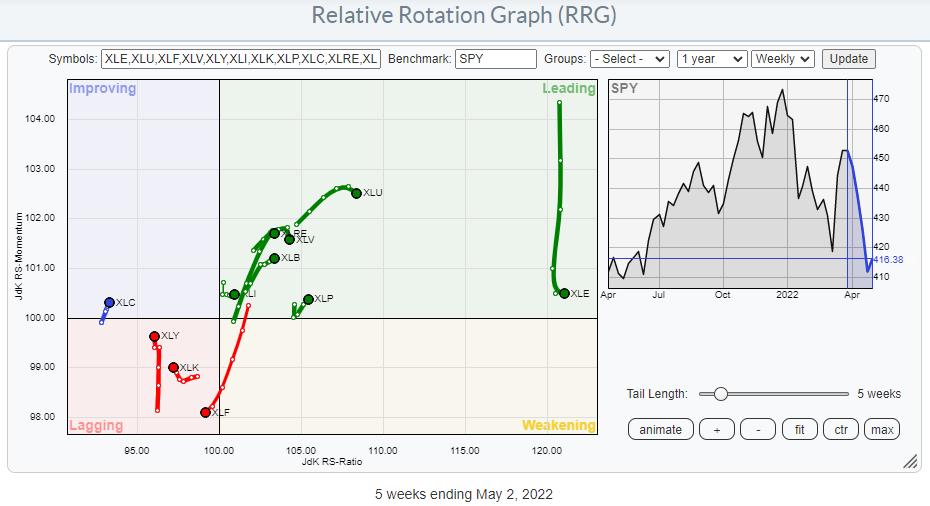
The current sector rotation still shows all defensive sectors inside the leading quadrant, albeit with a slight loss of relative momentum (JdK RS-Momentum scale). Nevertheless, the relative uptrends in those sectors are still intact.
Consumer Staples
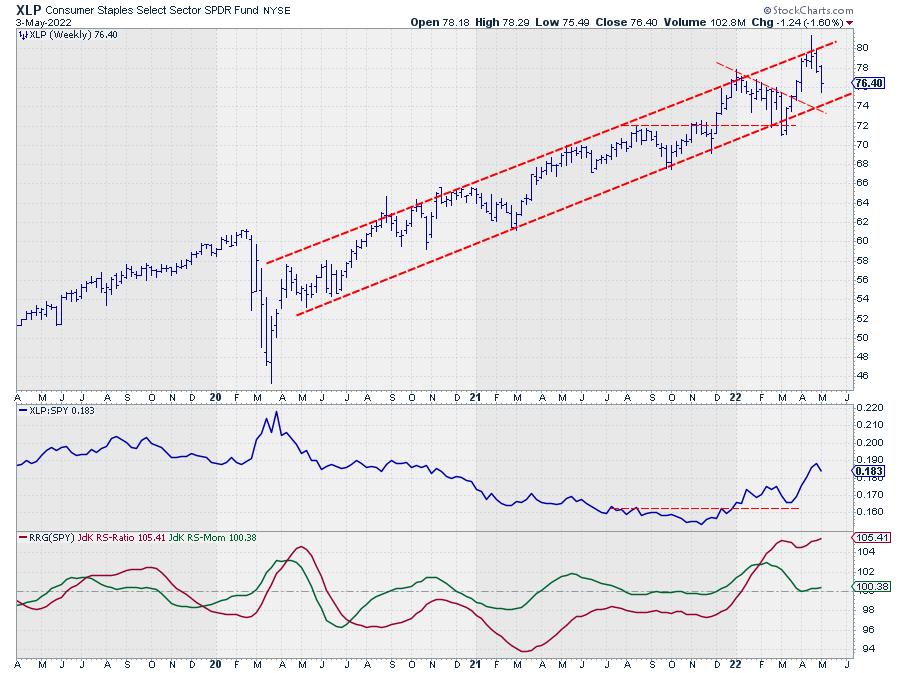
Relative strength of the staples sector vs. SPY is in a clear pattern of higher highs and higher lows, which keeps the RRG-Lines above 100. The current rotation shows the tail for XLP hooking back up into leading from the 100 levels on the RS-Momentum scale. Combined with the uptrend in price which is still well inside its rising channel, Staples remains one of the stronger sectors.
Utilities
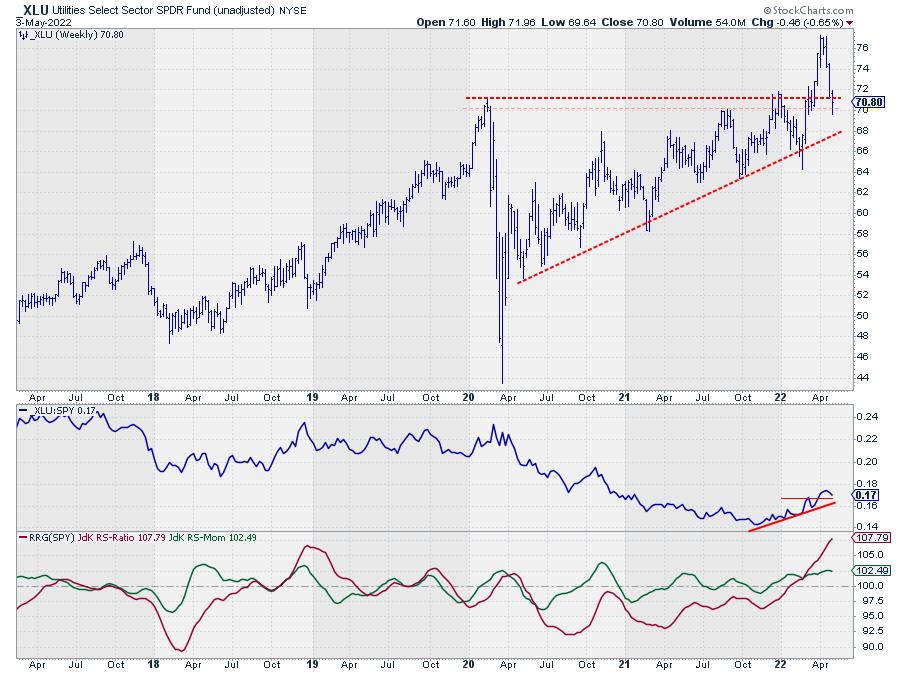
Relative strength is holding up well after breaking above its previous peak, which keeps the RRG-Lines above 100 and the tail inside the leading quadrant. The loss of relative momentum is, for the time being, judged as temporary, as the XLU tail is highest on the RS-Momentum scale, second highest on the RS-Ratio scale and has enough room to maneuver and complete a rotation on the right side of the RRG.
On the price chart, the sector is challenging its former breakout level in the 70-71 range. Being able to hold at these levels would underscore the current strength of utilities. If that is not possible, it will weaken the current picture, but not dramatically, as the next support level is already found near 68.
Healthcare
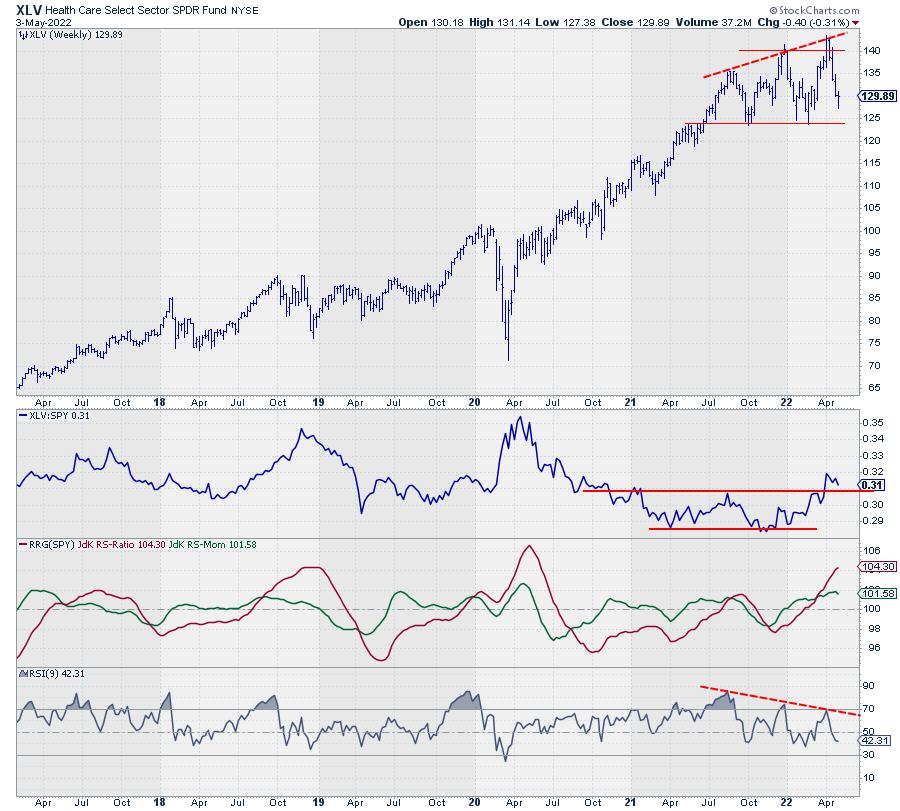
The tail for XLV on the RRG is comfortable inside the leading quadrant, but starting to roll over like Utilities, albeit from a lower level. The relative strength for this sector is still very healthy, the break from the range holding up and keeping both RRG-Lines above 100.
The price chart, imho, looks less favorable. XLV was not able to hold the upward break and dropped back into the range between 125-140, which is a sign of weakness. The support level just below 125 will now become pretty crucial given the strong negative divergence with the RSI.
Negative divergences often signal a pause within the current trend or a reversal. This means that the 125 area needs to hold as support and maintain the "pause" scenario. A clear break lower will very likely be followed by an acceleration lower, supported by the strong negative divergence between RSI and price.
The high number of sectors inside the leading quadrant is caused by the fact that over 50% of market capitalization is inside the lagging quadrant. Technology (27%), Discretionary (13%) and Financials 11%) are all heavyweights in terms of market capitalization, and they are all in relative downtrends.
Financials
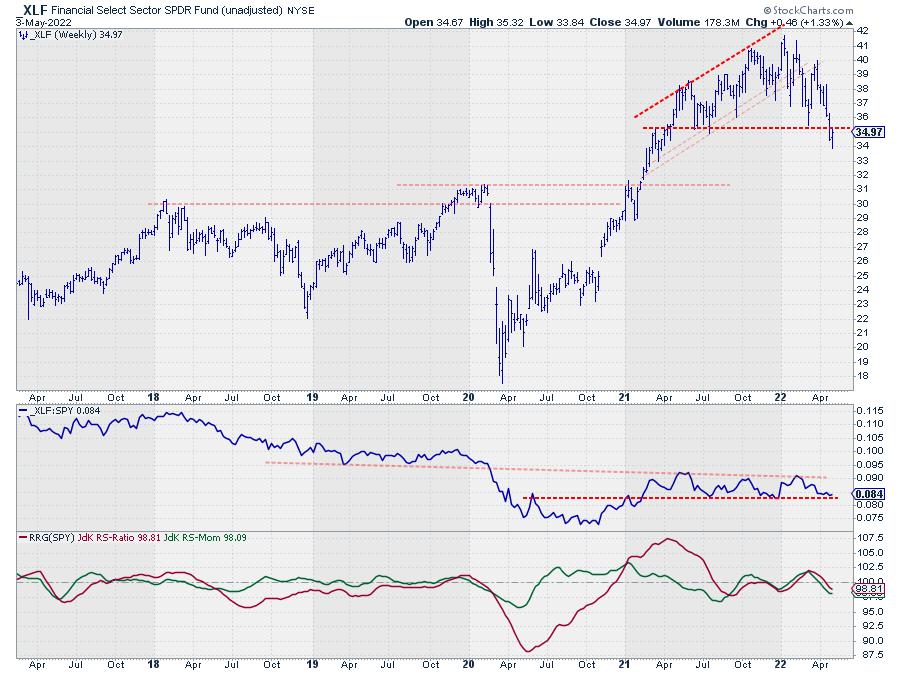
Last week, XLF broke below important horizontal support near 35. This week, so far, it is testing that former support level as resistance. This break confirmed the series of lower highs and lower lows in the sector and opened up the way to the next support area, which is found around 31.
From a relative strength perspective, the RS-Line is still holding above support, while the RRG-Lines are already pointing lower and starting to pick up a new downtrend, sending the tail into the lagging quadrant at one of the longer tail-lengths in the universe.
Technology
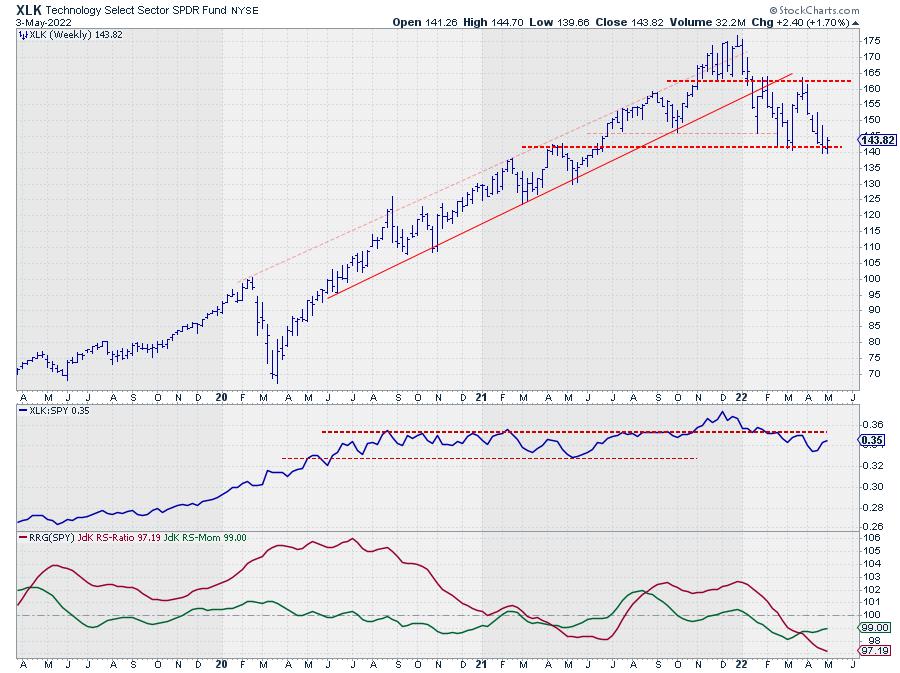
For the second time in a few months, the technology sector is testing the very important support level near 140. Last week's low was 139.75 and this week, so far, shows a low of 139.66.
A break below $ 140 will signal the completion of a large topping formation and most likely cause an acceleration lower for XLK.
Based on the height of the range that is visible since the start of this year, such a break will unlock around $20 of downward risk.
The series of lower highs and lower lows in relative strength is translated into a tail that is located inside the lagging quadrant. The slight deceleration in the decline in RS causes the green RS-Momentum line to move slightly up for the time being. Given the weak condition of both price and RS, this has to be judged as temporary for now.
Consumer Discretionary
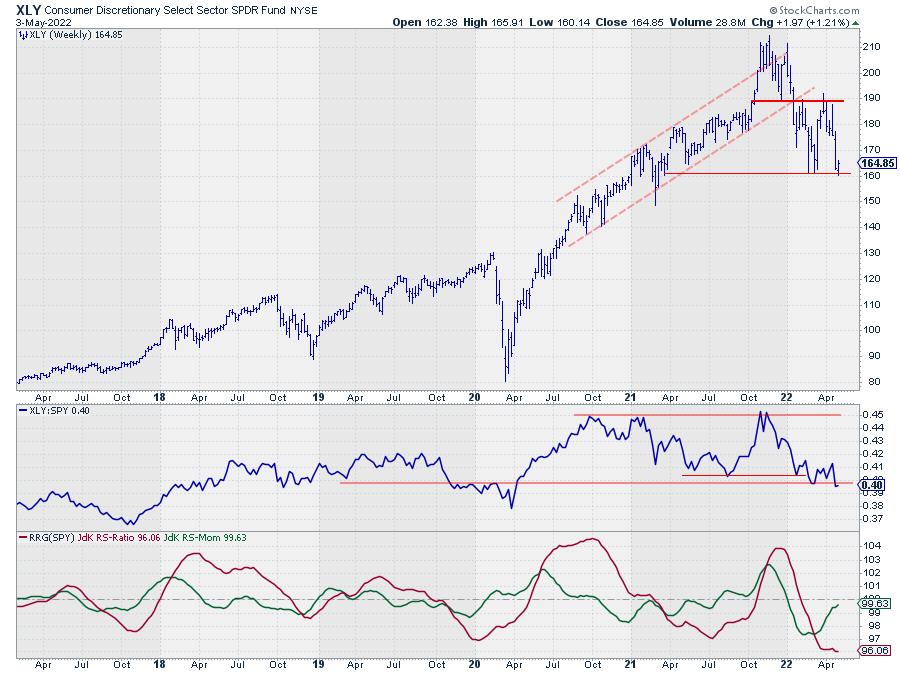
After dropping out of its rising channel in January, XLY came to a rest near 160 and rallied back to 190. At the moment, we are still inside that range, but closing in on the lower boundary again. Relative strength for this sector is in a range already since the end of 2020 and, at the moment, also challenging the lower boundary of that range.
The image is quite similar to that of Technology.
$160 is a crucial support level for XLY; a break lower will open up new downside risk towards the next major support level, which is only found near 130.
All in all, defensive sectors remain strong despite some short-term weaknesses. The threats in both consumer discretionary and technology of breaking below major support levels pose a real risk to the S&P 500. When these sectors accelerate, lower it will be very hard, if not impossible, for SPY to move higher.
#StaySafe, --Julius
Julius de Kempenaer
Senior Technical Analyst, StockCharts.com
Creator, Relative Rotation Graphs
Founder, RRG Research
Host of: Sector Spotlight
Please find my handles for social media channels under the Bio below.
Feedback, comments or questions are welcome at Juliusdk@stockcharts.com. I cannot promise to respond to each and every message, but I will certainly read them and, where reasonably possible, use the feedback and comments or answer questions.
To discuss RRG with me on S.C.A.N., tag me using the handle Julius_RRG.
RRG, Relative Rotation Graphs, JdK RS-Ratio, and JdK RS-Momentum are registered trademarks of RRG Research.


