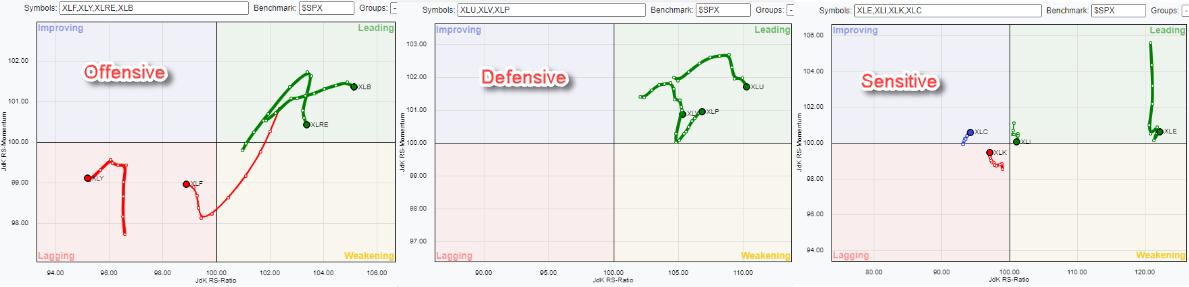
Breaking down the US sector universe into three groups (as opposed to two) -- Offensive/Cyclical, Defensive and Sensitive -- shows the current rotations as seen in the Relative Rotation Graphs above.
It is pretty clear, IMHO, that the defensive group (still) stands out. All three sectors -- Consumer Staples, Healthcare and Utilities -- are positioned inside the leading quadrant. While Staples picked up, Utilities and Healthcare have started to lose some Relative Momentum in the past weeks. The high JdK RS-Ratio readings and the fact that all tails are still moving higher on this axis indicates that these relative UPtrends are still intact.
The group of offensive/cyclical sectors shows Consumer Discretionary and Financials inside the lagging quadrant and traveling at a negative RRG-Heading. Real-Estate and Materials are inside the leading quadrant, where Real-Estate recently sharply hooked down.
The Materials sector was, and probably still is, the odd one out in this group. Only this week, the sector lost some relative momentum, but, over the last 10 weeks, the tail on XLB has moved at a very nice RRG-Heading further into the leading quadrant, making it one of the more interesting and stable sectors in the universe recently.
In the group of sensitive sectors, obviously, Energy stands out, far to the right and still at very high JdK RS-Ratio readings. And, over a few weeks, the sharp drop on the RS-Momentum axis seems to be stalling just above 100.
Communication Services is the weakest sector in this group based on the low RS-Ratio reading, but, as you may recall, we have discussed the fact that XLC has reached a very long-term support level and is still holding up in that region. This lowered the speed of the relative downtrend and thus a pick-up in relative momentum, putting XLC inside the improving quadrant.
To a lesser degree, the same goes for the Technology sector. The decline in both price and relative strength has come to a temporary(?) standstill and is showing a small rally. Other than that, it is way too early to call for a reversal of the trend, which is still down.
Industrials is still inside the leading quadrant, but close to the benchmark and close to crossing over into weakening.
All in all, defensive sectors remain strong, while cyclical and the growth sectors inside sensitive remain weak. There are some signs of improvement, but, for the time being, these look more like recoveries rather than reversals.
Price Trends
With the current weakness in the stock market, it often pays to use $ONE as the benchmark for RRGs to get a handle on the trends in price, rather than relative.
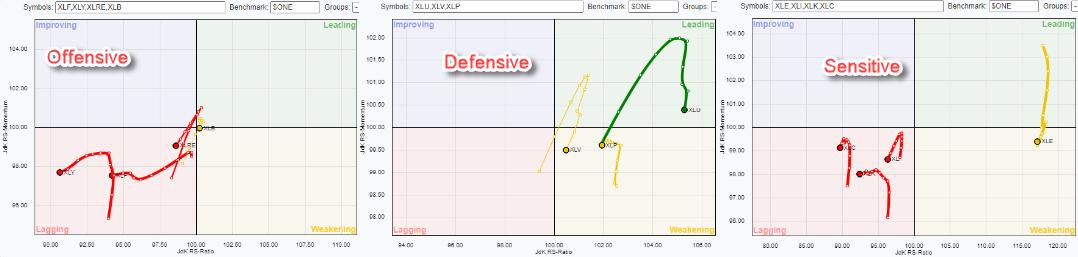
This makes it crystal clear that all offensive sectors are in a downtrend. All three defensive sectors are on the right-hand side of the graph, hence in uptrends, but two are losing momentum. And in the group of sensitive sectors, three sectors are clearly inside the lagging quadrant and moving lower.
All in all, a significant part of the market, especially when you look at market capitalization, is now in a downtrend.
This is not an environment that points to a new rally being around the corner.
Materials
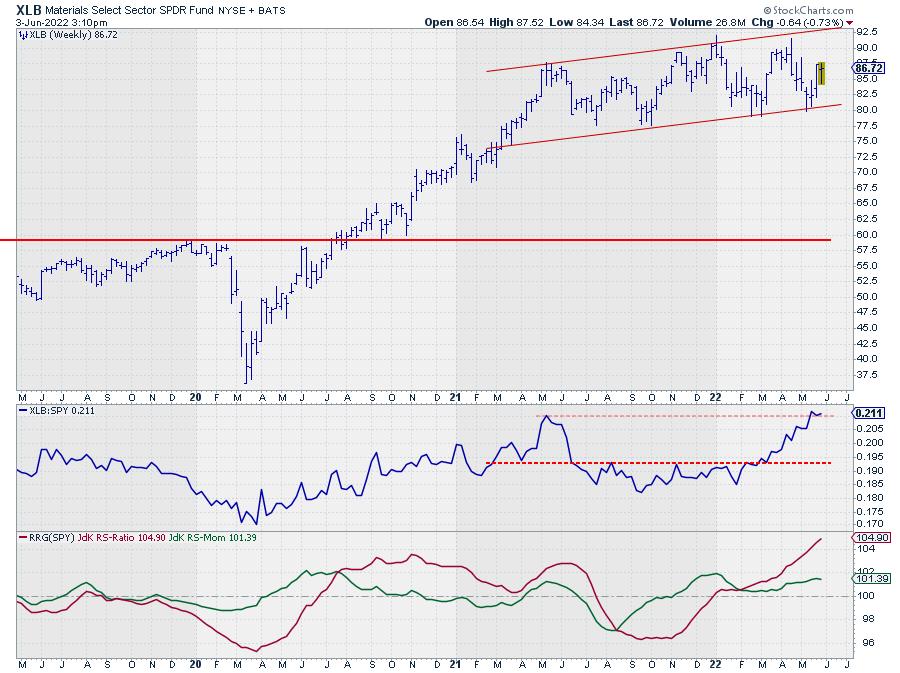
The price chart for XLB remains within the boundaries of its uptrend and has just started a new up-leg after testing the lower boundary.
The strong relative rotation of the Materials sector in these market conditions makes me want to investigate the group rotations inside that sector.
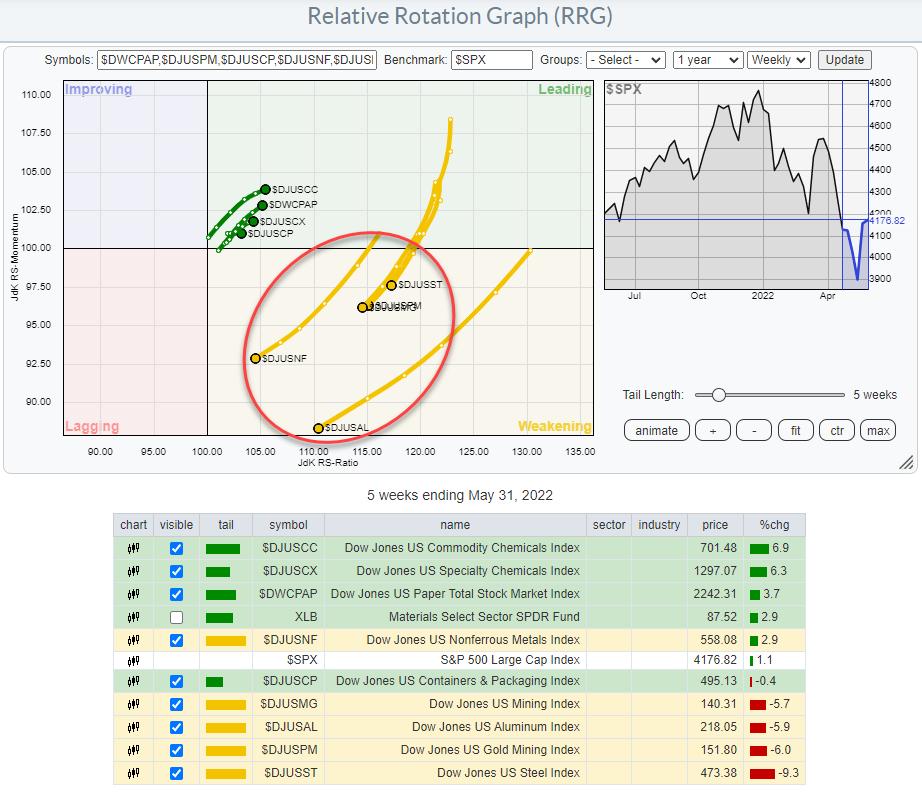
This RRG shows the rotations for the groups inside the materials sector (plotted against $SPX) and it clearly shows two things:
- As the universe is plotted against the S&P500 index, the fact that all groups are to the right of the benchmark confirms the current strength of the sector.
- A very clear split in two sides...
First, there is the group inside the leading quadrant, which is at a positive RRG-Heading moving deeper into the quadrant. And then there is another group, all inside weakening and moving at a negative RRG-Heading. This group also has significantly longer tails than the group that is moving into the leading quadrant.
The theme for this group moving inside the weakening quadrant is very clear: Metals and Mining. All these groups are related to some form of metals or mining of those metals. Hence, within the Materials sectors, the Metals and Mining groups are better avoided for the time being. They have played an important role in leading the sector higher in recent months, but they seem to be taking a breather now.
Commodity Chemicals, Specialty Chemicals and Paper seem to be the preferred groups in the coming weeks.
Commodity Chemicals
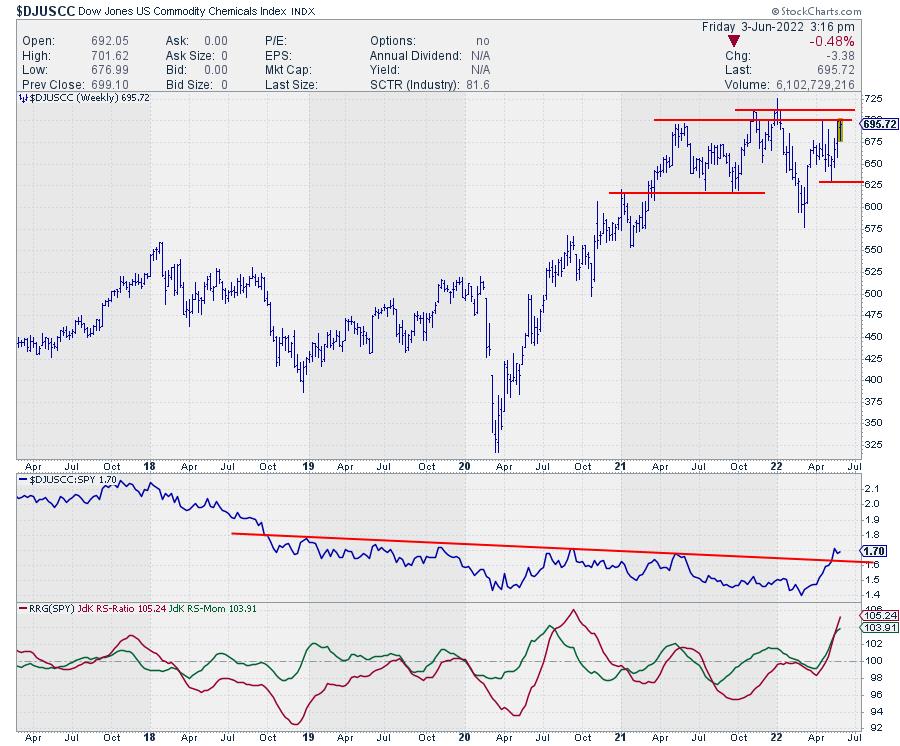
Out of these three groups, Commodity Chemicals has the highest RS-Momentum reading of the groups that are pointing further into leading.
The chart above shows the upward break in relative strength after a multi-year downtrend. In the price chart, $DJUSCC is pushing against overhead resistance in the range between 700-710. Once that area gives way, there will be much more upside potential for the commodity chemicals group.
All in all, defensive sectors remain strongest which is counterintuitive to a bull market. Like always, it is possible to identify pockets of (relative) strength that offer opportunities. Just be aware that you are investing in a weak environment for the stock market in general.
Have a great weekend, #Staysafe, and don't forget to tune in to Sector Spotlight on StockCharts TV every Tuesday from 10.30-11.00 AM ET or replay on YouTube or our on-demand channels, --Julius
Julius de Kempenaer
Senior Technical Analyst, StockCharts.com
Creator, Relative Rotation Graphs
Founder, RRG Research
Host of: Sector Spotlight
Please find my handles for social media channels under the Bio below.
Feedback, comments or questions are welcome at Juliusdk@stockcharts.com. I cannot promise to respond to each and every message, but I will certainly read them and, where reasonably possible, use the feedback and comments or answer questions.
To discuss RRG with me on S.C.A.N., tag me using the handle Julius_RRG.
RRG, Relative Rotation Graphs, JdK RS-Ratio, and JdK RS-Momentum are registered trademarks of RRG Research.


