Following the recent bounce in the stock market, predominantly driven by growth stocks, I wanted to investigate the rotations within the NYFANG+ index (or should it be NYMANA, nowadays?). This is a group of mega-cap stocks from the technology, consumer discretionary and communication services sectors.
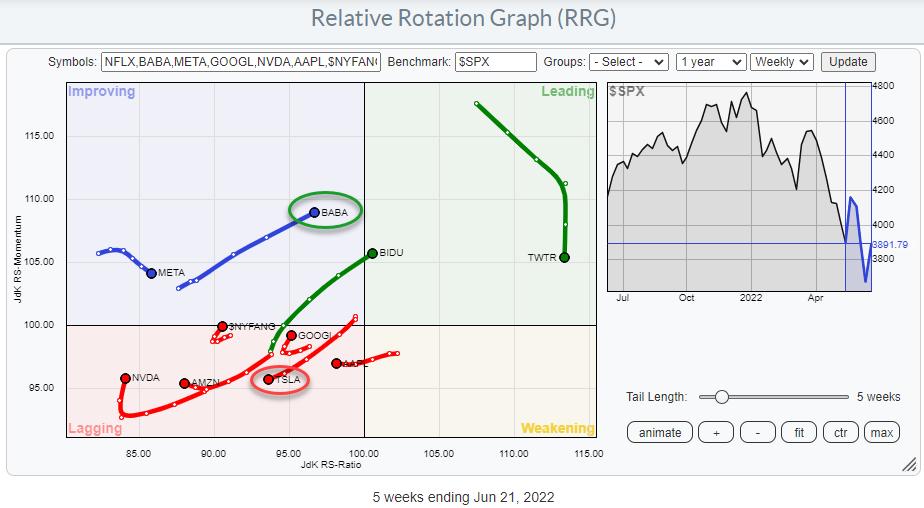
When we look at the Relative Rotation Graph above, which shows this universe against the S&P 500, we still see a big concentration of tails inside the lagging quadrant. Recently, however, a few of them started to show improving RRG headings.
On the RRG, I have disabled the tail for Netflix because it is so deep inside the lagging quadrant that it distorts the other tails on the graph. The graph shows the individual members of the index, as well as the index itself. You can find the $NYFANG index around the 100 level between the lagging and the improving quadrant, showing a very short tail which has just turned into a positive RRG heading. This means that the universe as a whole is in a relative downtrend versus the S&P 500, but has just started to show some signs of (relative) improvement. We will have to wait and see whether this is a temporary hiccup within the existing downtrend or the start of a turnaround into a new period of relative strength for mega-cap growth stocks.
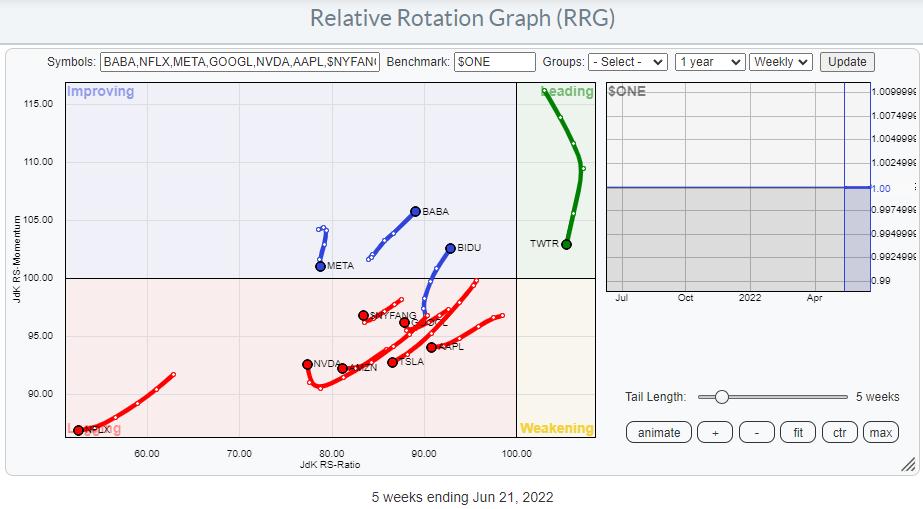
When we plot the same universe against $ONE to get a handle on price trends, I think we can safely conclude that it will take some time before we can really call for a new uptrend in terms of price.
Pair Trades
Regular readers of the RRG blog and watchers of Sector Spotlight on StockCharts TV will know that Relative Rotation Graphs are very well suited to look for pair-trading opportunities. As you know, in order to do that, we are looking for tails that move in opposite directions.
On this weekly version of the RRG, a few opportunities float to the surface. Potential candidates for (more or less aggressive) long positions are BABA, BIDU, GOOGL and NVDA. BABA and BIDU are rapidly moving towards the leading quadrant while showing long tails and a strong RRG heading. GOOGL and NVDA are more aggressive plays, as they are still inside the lagging quadrant but have just turned up into a strong RG heading.
Potential short candidates are META, AAPL and TSLA. META is inside the improving quadrant, but rolled over and is now heading back towards the lagging quadrant. AAPL has just moved from weakening into lagging and seems to be moving deeper into that quadrant. Finally, TSLA rotated from improving back towards lagging. moving deeper into it at a negative RRG heading.
Out of these potential candidates, I am particularly interested in BABA as a long position and TSLA on the other side. This is primarily because they are roughly at the same JdK RS-Ratio level while moving in opposite directions.
TSLA

After a massive run higher in 2020 and again in 2021, Tesla recently completed a massive top formation when it broke below support around 800, starting a new series of lower highs and lower lows. This means that the upside is now limited, with a lot of resistance to be expected in that 800 area, while downside risk is clearly present.
From a relative perspective, the RS line is in a pattern of lower highs and lower lows, which sends both RRG lines lower, pushing TSLA deeper into the lagging quadrant and making it a good candidate for the short side of a pair trade.
BABA
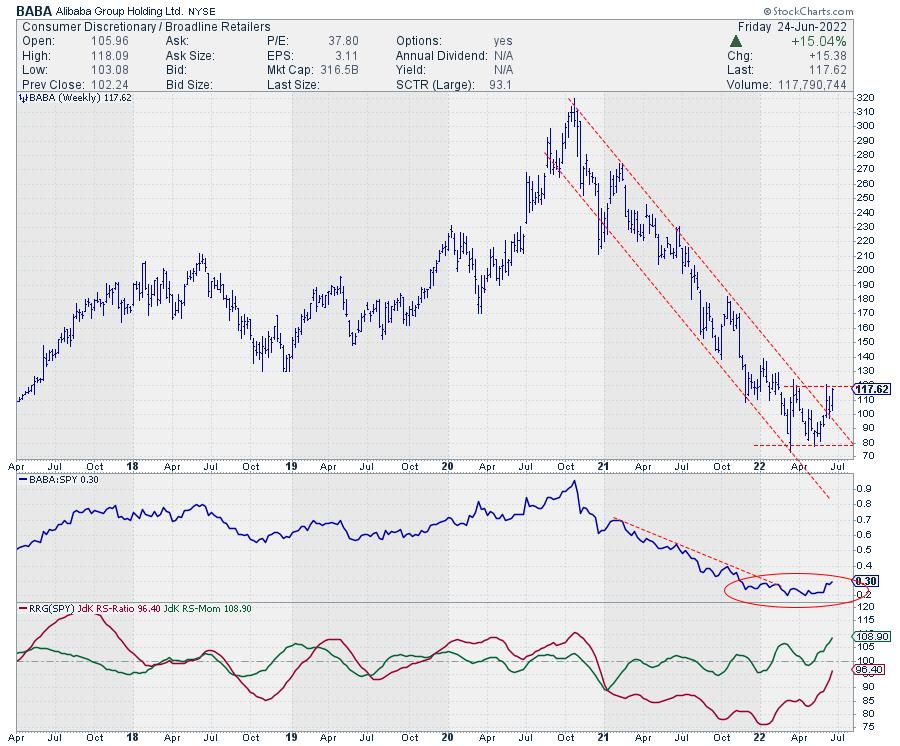
BABA, on the other hand, lost around 75% of its value, from the peak of around 320 at the end of 2020 to the low of around 80 a few weeks ago.
This entire downtrend was captured within the boundaries of a falling channel and a very regular pattern of lower highs and lower lows. After failing to break below support around 80 and pushing above the falling resistance line, BABA's declining relative strength versus the S&P 500 first stalled, then started to pick up momentum. With price now pushing against resistance just below 120 and relative strength on the rise, BABA could be a strong candidate for a long position in a pair trade against TSLA.
BABA:TSLA
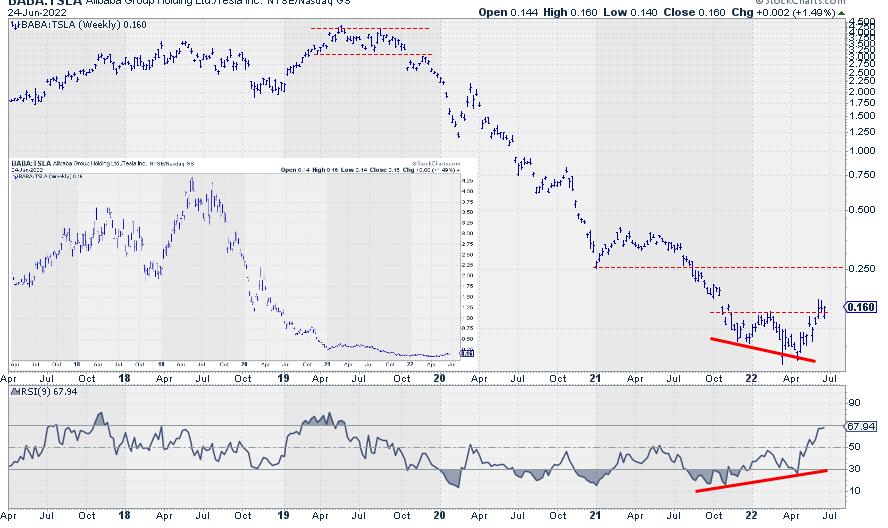
Finally, this is what you get when you put BABA (Jack Ma) and TSLA (Elon Musk) against each other 1-1. The massive downtrend from the peaks around 4 in 2019 towards the lows around 0.1 a few weeks ago is clearly visible and amounts to roughly 97.5%.
As this chart is plotted on a semi-log scale, I am reluctant to draw a falling trendline over the peaks since 2019. Although it looks to fit nicely, it would not be correct, IMHO, as the line would need to be curved. See the arithmetic chart on the inset.
That massive trend in favor of TSLA over BABA now seems to be reversing, as the ratio has broken its previous high and a positive divergence between the ratio and its RSI has started to work. From its current level at 0.16 to the next resistance level near 0.25 is already more than 50% upside potential.
For three years, Musk has shown Ma all corners of the ring, but that situation seems to be changing now.
Julius de Kempenaer
Senior Technical Analyst, StockCharts.com
Creator, Relative Rotation Graphs
Founder, RRG Research
Host of: Sector Spotlight
Please find my handles for social media channels under the Bio below.
Feedback, comments or questions are welcome at Juliusdk@stockcharts.com. I cannot promise to respond to each and every message, but I will certainly read them and, where reasonably possible, use the feedback and comments or answer questions.
To discuss RRG with me on S.C.A.N., tag me using the handle Julius_RRG.
RRG, Relative Rotation Graphs, JdK RS-Ratio, and JdK RS-Momentum are registered trademarks of RRG Research.


