In this article, I'd like to dig a bit deeper into the Industrial sector.
Starting at the sector level, we find the tail for XLI inside the weakening quadrant and moving towards lagging. So definitely not one of the better sectors. As a matter of fact, it's one of the sectors that is about to start underperforming the S&P 500 index.
Sector Level
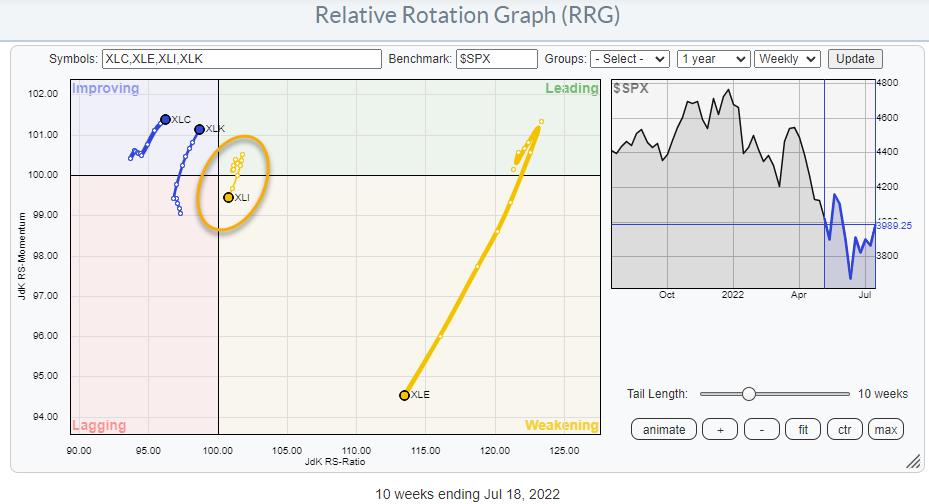
The industrial sector is one of the sensitive sectors (vs. offensive and defensive) together with communication services (XLC), technology (XLK) and energy (XLE). They are plotted on the RRG above.
It becomes instantly clear that this "sensitive" group is split in half. On the one hand, XLK and XLC are inside improving and traveling at a strong RRG-Heading towards leading. On the other hand, XLI and XLE are inside weakening and traveling at a negative RRG heading towards lagging. XLE still has some wiggle room, as it is going through a setback after a massive rally. XLI is different as it is very close to crossing over into the lagging quadrant.
In terms of market capitalization, industrials are a mid-tier sector at 8% of the S&P 500. But the industrial sector is a big sector in terms of groups and individual stocks inside those groups. XLI holds 71 individual stocks. When you go to the sector summary page and click the RRG icon for XLI, you will get the RRG that shows the industries inside XLI. All 16 of them.
16 Industries Inside Industrials
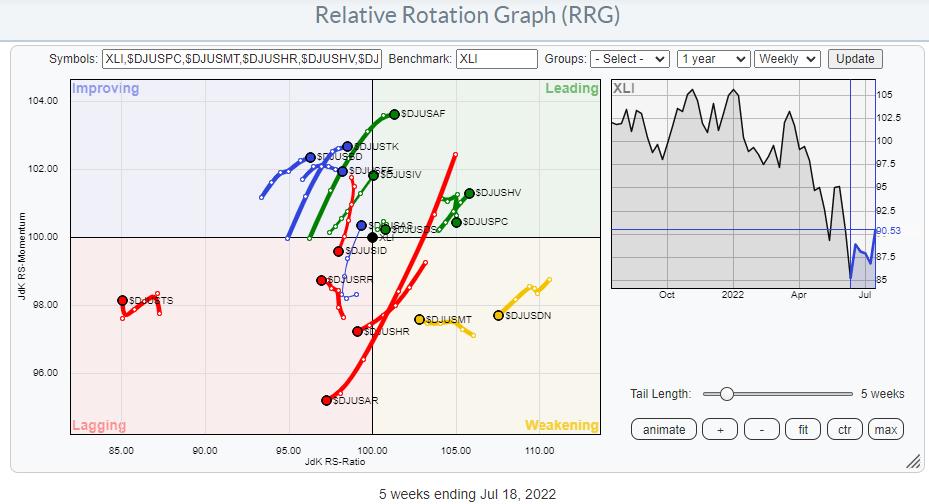
When plotted against XLI as the benchmark, we get the picture above.
Some of these tails are long and nicely pointing in a clear direction, while many are less decisive. Even if I plot all the groups against SPY, the spread remains fairly even across the entire image, which means that there is no clear direction for the sector as a whole. This explains why XLI is/remains so close to the benchmark at the moment.
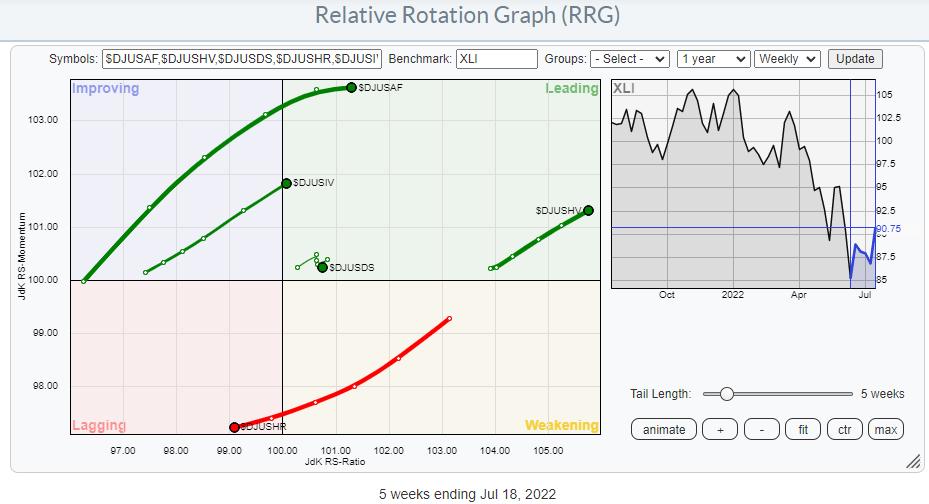
By browsing through all tails, using the arrow keys on my keyboard to highlight the next tail, I have identified a few groups worth extra attention. I have highlighted these groups on the RRG below.
Commercial Vehicles & Trucks - $DJUSHR
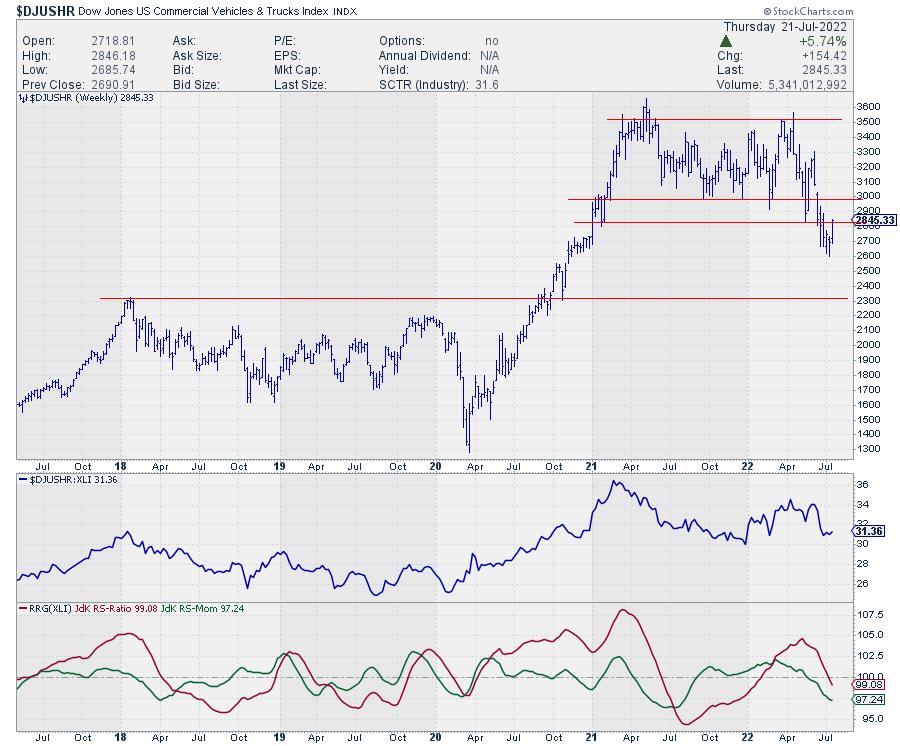
This is very clearly a weak group, and it's a group inside the industrial sector that I'd like to avoid.
Both RRG-Lines are pushing lower below the 100-level, taking the tail deeper into the lagging quadrant. This follows the weakness in the RS-line that has started to increase after rolling over, putting a new relative peak in place.
But maybe even more important is the massive top-formation that was recently completed after the index broke below support near 3000. After the break of this horizontal support level, the index has now started to recover somewhat, but, as far as I'm concerned, that is only a pullback towards the breakout level, where the market will very likely find resistance. So the upside here is very limited.
Industrial Suppliers Index - $DJUSDS
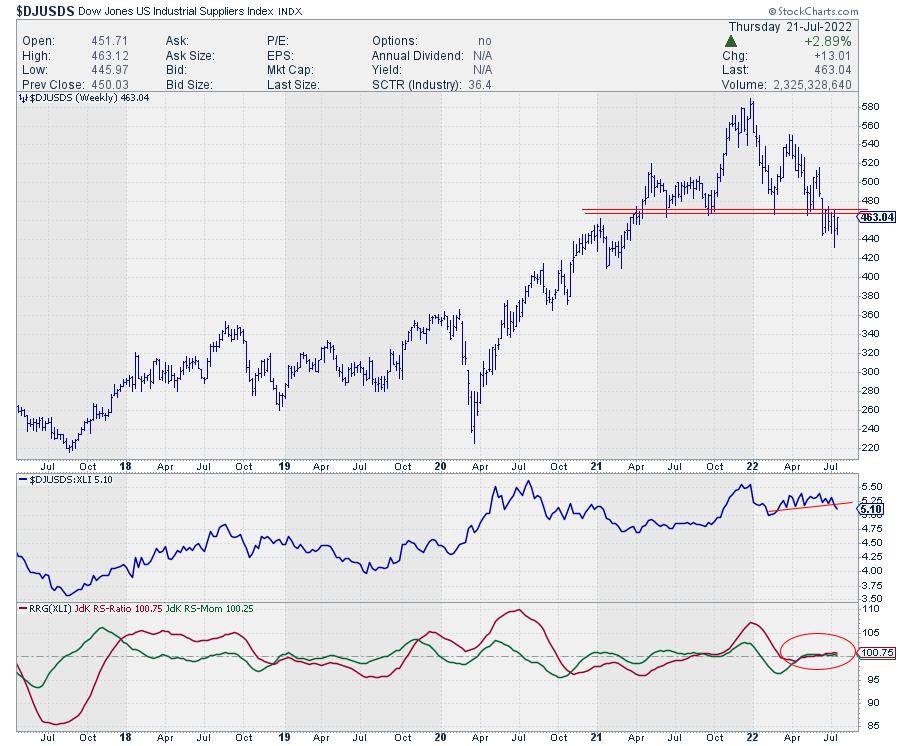
The Industrial Suppliers group has an unusual tail. It is inside the leading quadrant, very short and with no clear direction. This becomes clear when you look at the RRG lines, which are almost on top of each other and only just above the 100-level.
Looking at the raw RS-line shows that it has just started to break away lower from a small trading range and is picking up downside momentum. Combining that with a big topping formation that was recently completed in the price chart suggests that the tide is shifting towards a more negative outlook for this group.
The break below support in the 470 area was definitely a negative signal from a price perspective and is now starting to take its toll on relative strength. Continued weakness for this group will rapidly push it down into weakening, likely into lagging after that.
Delivery Services - $DJUSAF
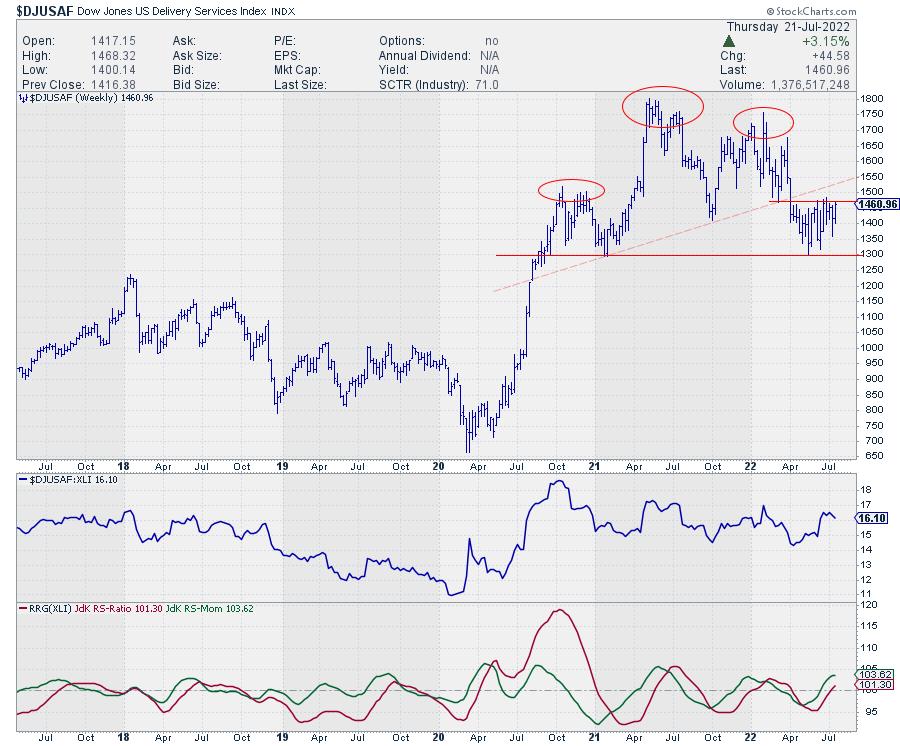
This group has the highest JdK RS-Momentum reading and pushed into the leading quadrant a few weeks ago. It is picking up on the JdK RS-Ratio scale.
At first sight, that looks like a strong and interesting rotation. And, from a relative point of view, it certainly looks strong. Especially when the RS-line can push beyond the overhead resistance that it is currently attacking. However, when we bring in the observations from the price chart, things are not so rosy. It looks as if we had a massive head-and-shoulders reversal that formed over the last year and a half, which is now starting to take its toll.
Going with that observation, we have now had the initial decline, and the market is pulling back and did not even make it back to the neckline, which is weak from a price perspective. So price and relative are presenting us with conflicting pictures. From a relative point of view, things look pretty strong for the group. From a price point of view, not so much. There is this big reversal pattern which, I think, is still in play, but there are also the first higher lows being put into place. And it looks as if we're pushing against resistance around 1470.
Hence, this can go both ways. If we take out 1470-1500, more upside will be unlocked, potentially back above that neckline. In that case, the delivery services index will definitely improve further and push that relative strength further up. On the other hand, if that fails and the decline continues, we break 1300, and then there is much more downside to be expected for this delivery services index.
Tradable opportunities will very likely arise in either scenario, but we have to wait for the market to choose its direction and act accordingly when it happens. In this case, I am watching 1300 on the downside and around 1500 on the upside.
Heavy Construction - $DJUSHV
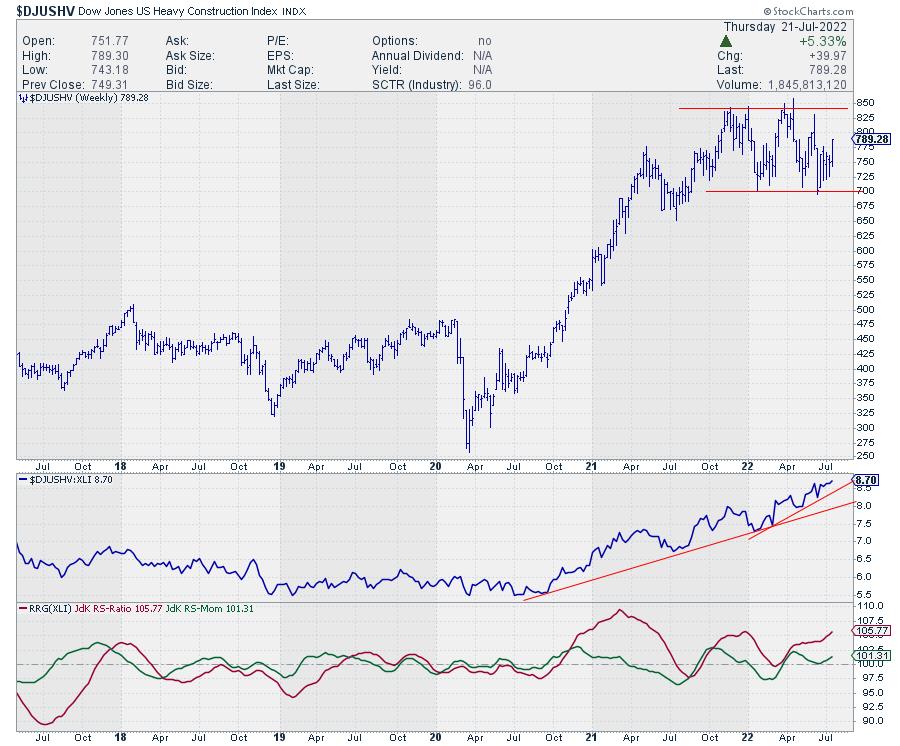
The relative strength for the heavy construction index is still nicely moving higher in an uptrend that started back in the summer of 2020 and is still in play. On the Relative Rotation Graph, this results in a tail that is deep inside the leading quadrant and moving further into it at a strong RRG-Heading.
On the price chart, $DJUSHV is caught in a trading range between 700-840, currently moving up towards the upper band of that range. At the moment, there is very little that points to a potential upcoming weakness for this group, which makes it one of the stronger industries within the industrial sector.
Business Support Services - $DJUSIV
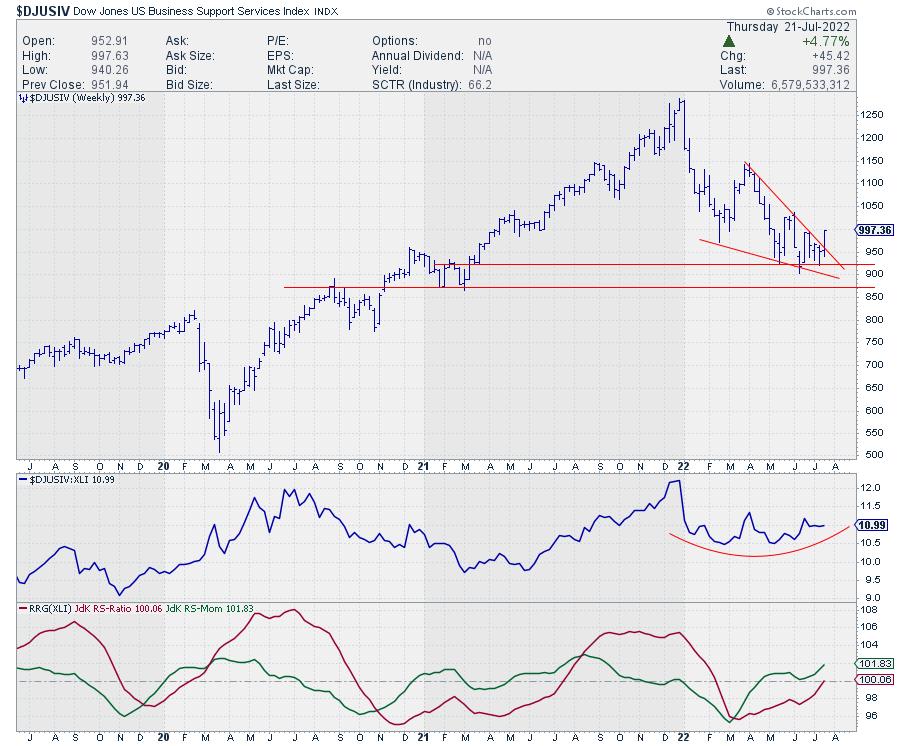
Saving the best for last. The Business Support Services index has just crossed over into the leading quadrant following a slow turnaround in the raw RS-Lines, which is still in the process of bottoming out after a dip that started at the beginning of the year.
The improvement of relative momentum (green JdK RS-Momentum line) has now resulted in the RS-Ratio line also moving above the 100-level, pushing the tail into the lagging quadrant. What makes this group especially interesting is the fact that it arrived at an important support level a few months ago and it is still holding up above that level (~ 900).
Against that support level, a falling wedge pattern was formed, and, this week, $DJUSIV seems to be leaving that wedge to the upside, which suggests a bullish follow-through. Combined with the improving relative strength, this makes it the group with the biggest upside potential at the moment.
#StaySafe, --Julius
Julius de Kempenaer
Senior Technical Analyst, StockCharts.com
Creator, Relative Rotation Graphs
Founder, RRG Research
Host of: Sector Spotlight
Please find my handles for social media channels under the Bio below.
Feedback, comments or questions are welcome at Juliusdk@stockcharts.com. I cannot promise to respond to each and every message, but I will certainly read them and, where reasonably possible, use the feedback and comments or answer questions.
To discuss RRG with me on S.C.A.N., tag me using the handle Julius_RRG.
RRG, Relative Rotation Graphs, JdK RS-Ratio, and JdK RS-Momentum are registered trademarks of RRG Research.


