Relative Rotation Graphs (RRG) were introduced on StockCharts.com in July 2014. Since then, we have had the possibility to render the charts using weekly or daily data. Primarily, I think, because those were the time frames I was, and am, using most of the time for myself and in conversations and research for institutional investors, who usually have a bit of a longer-term investment horizon.
With the introduction of RRG on StockCharts.com, a lot more eyeballs have started looking at RRGs and using them in different ways and setups. One of the most requested functionalities since its introduction was to make RRGs available for intraday time frames. I know now, with hindsight and from eight years of experience working with StockCharts.com, that there are a lot of shorter-term oriented traders, and swing-traders on the site. A daily RRG was a nice to have for them, but it would only give them a very high-level picture given their investment horizon.
The wait is now over. With the latest release (Bainbridge) of the website, Relative Rotation Graphs can now be run on intraday data as well.
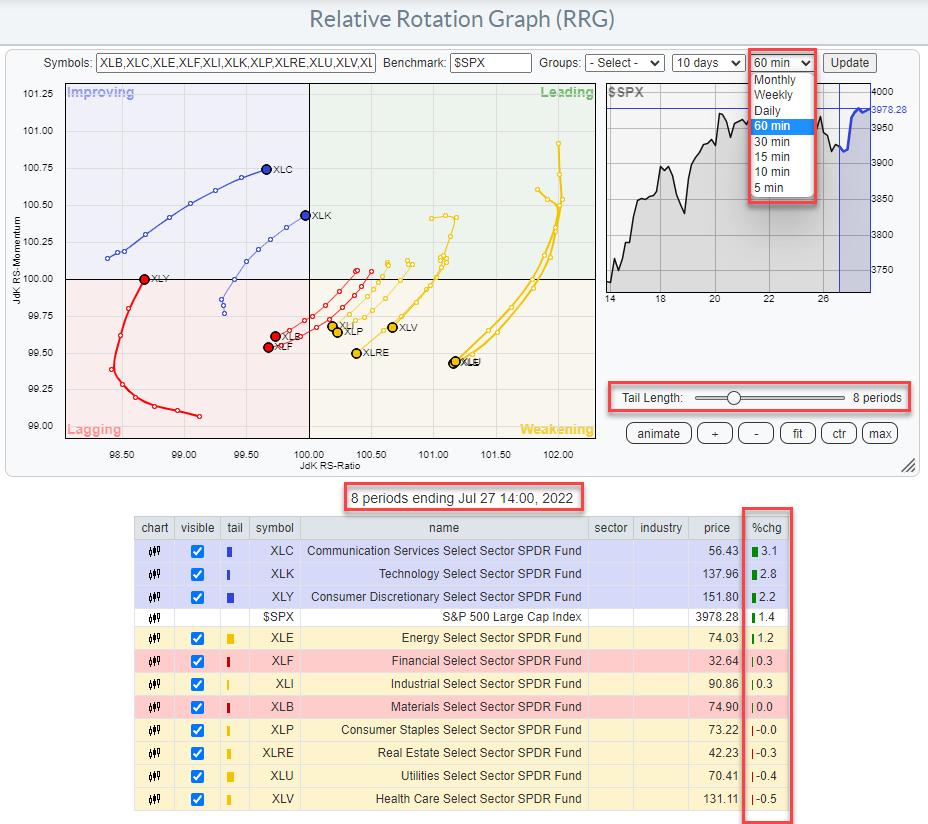
When you go to the RRG page and open the drop-down menu for the time frames, you will now see many more options besides weekly and daily. For long-term investors, the monthly time frame has been added, which allows monitoring of really long rotations and their resulting trends. Meanwhile, the intraday periods that are available are 60, 30, 15, 10 and 5 minutes. These should give short-term traders enough choices to pick a time frame that suits their trading style.
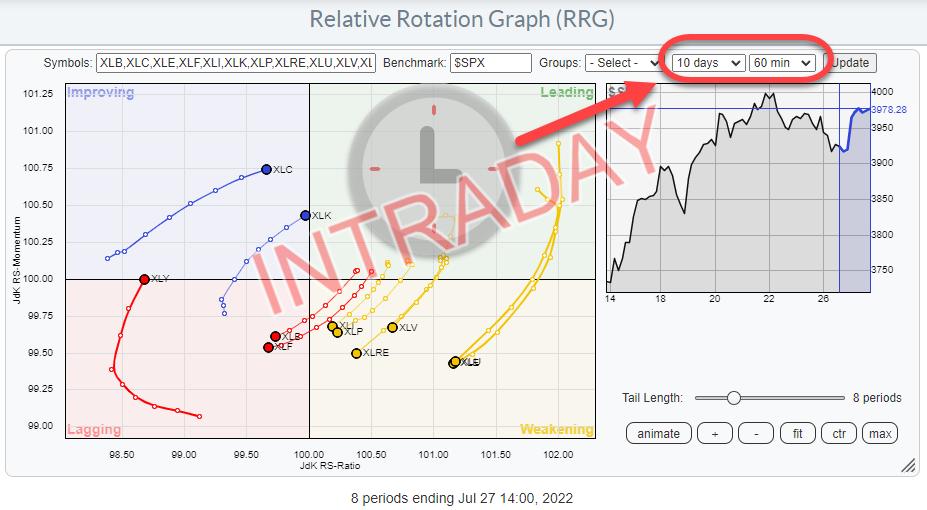
The RRG above is using 60-min timeframes. The tail length of 8 periods, therefore, covers 8 hours of trading. And the date/time stamp below the chart tells you the last update of the graph; in this case, the 60-min period starting 14:00 on July 27.
*Date/Time stamps on StockCharts are always at the start of the period. Thus, the last observation on a weekly chart will be Jul 25 this week, as that was the Monday when this week started. Also, the date stamp for a monthly chart will be on the first of the month.
As a result, the %chg column in the table below the chart will show the percentage change over the 8 periods = 8-hour length of the tails on this chart.
Just like regular intraday charts, the trends and distances traveled in terms of price will be much smaller than on daily or weekly charts. What seems to be a nice uptrend on an hourly chart (bar chart or RRG) can be invisible on a daily or weekly chart. As long as you are aware of the finesses and the implications of using intraday time frames, these new periodicities on RRG can help you get a better handle on developments that are taking place intraday, or over the course of a few days, which would be very hard to spot on daily or even weekly RRGs.
Just like you can use Weekly and Daily RRGs alongside each other to get a handle on the rotations in different time frames, you can do exactly that with 60- and 10-min RRGs, as an example.
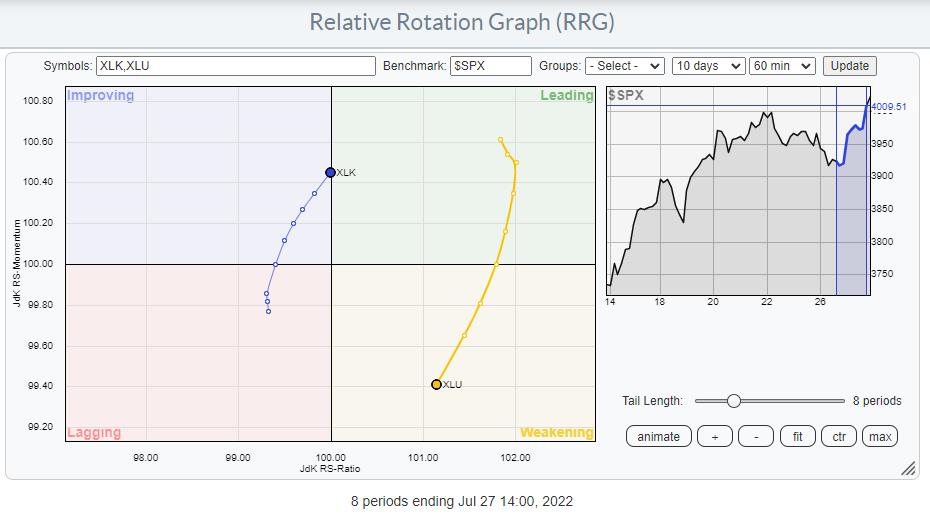
This first RRG shows the completed 60-min tails for XLK and XLU. The last period started at 14:00, which means that this is at 3pm in terms of time. XLK is about to cross over into the leading quadrant at a strong RRG-Heading, while XLU is now inside the weakening quadrant and moving towards lagging at a negative RRG-Heading.
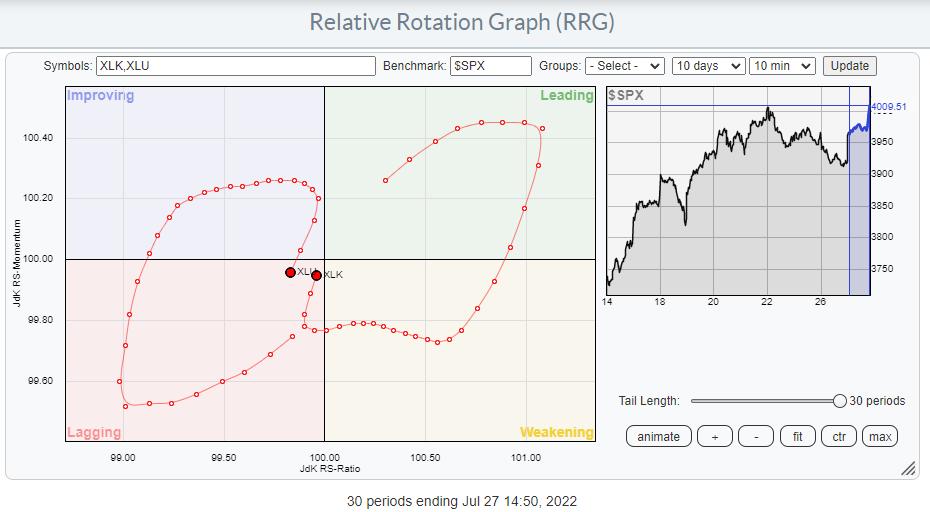
This second RRG has 10-minute tails and the last observation started at 14.50. So this snap is also at 3pm. With the tail length set at 30, we are looking at the 10-min rotation over the last 5 hours (=300 minutes). What we see here is that the tails for XLU and XLK started in sync with the hourly rotations, XLU at a negative heading and XLK at a positive heading. Then, the 10-min tails started to rotate in opposite directions until an hour ago or so, when they started to converge again with the hourly rotations.
So, just like you can combine weekly and daily RRGs, you can also combine, say, hourly and 10-min RRGs, or daily and hourly, etc., etc.
The addition of these new time frames significantly opens up more possibilities to use RRG and makes them attractive to a larger group of investors/traders.
As usual, I remain open to any feedback or comments.
#StaySafe, --Julius
Julius de Kempenaer
Senior Technical Analyst, StockCharts.com
Creator, Relative Rotation Graphs
Founder, RRG Research
Host of: Sector Spotlight
Please find my handles for social media channels under the Bio below.
Feedback, comments or questions are welcome at Juliusdk@stockcharts.com. I cannot promise to respond to each and every message, but I will certainly read them and, where reasonably possible, use the feedback and comments or answer questions.
To discuss RRG with me on S.C.A.N., tag me using the handle Julius_RRG.
RRG, Relative Rotation Graphs, JdK RS-Ratio, and JdK RS-Momentum are registered trademarks of RRG Research.


