Staying out of a sector can be as important as being in the right sector. This is particularly true for the Communication Services Sector, and has been for a long time already.
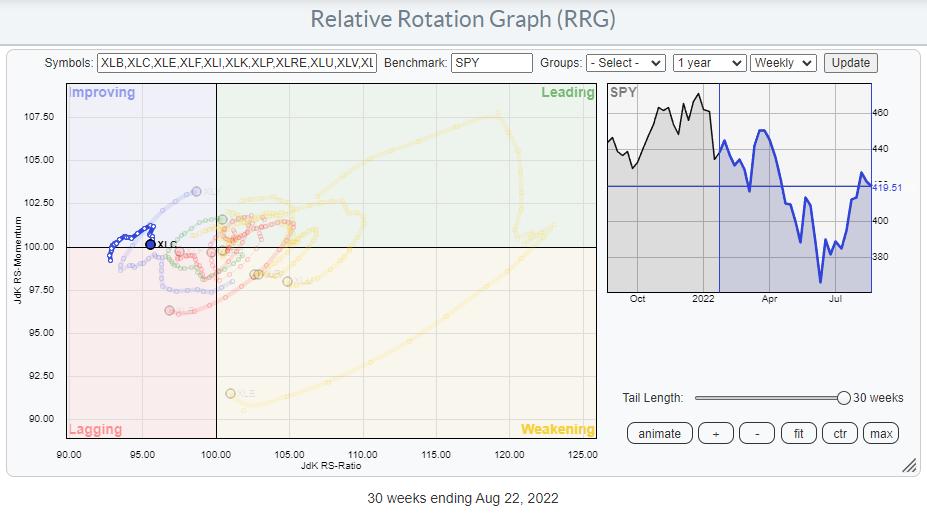
The Relative Rotation Graph above shows the rotation over the last 30 weeks, starting the week of 1/24. Prior to this period, XLC had already traveled deep into the lagging quadrant, underperforming the S&P 500 by a mile. The start of the tail picks up the rotation when the sector had started to pick up some relative momentum, crossing over into the improving quadrant.
As we can see in the chart above, this rotation was short-lived, and the tail has started to roll over back down again and is now on the verge of crossing back into the lagging quadrant.
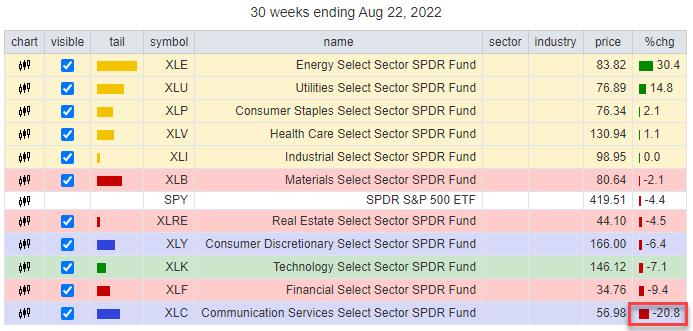
The table above shows the performance of the sectors over this 30-week period. XLC is at the bottom of the list with a loss of 20.8% over the last 30 weeks. Compare that with the 30.4% gain for the energy sector at the top of the list. That's a difference in the performance of more than 50%.
Does that mean you could have gained 50% over that period? If you had a "God" strategy (one that picks exactly the right sector at the right time) that shorted XLC and went Long XLE in equal amounts, then Yes. But that would have been a very aggressive trade. Let's get a bit more realistic here.
Suppose you are running a portfolio of ETFs and you want to outperform the S&P 500. How much would you have gained by staying out of XLC over that period? Not 20.8% The weight of the Communication Services sector in the S&P 500 is 8.4%, so that -20.8% loss only hurt the S&P 500 by 8.4%. If your portfolio would have positions in all sectors at the correct weights, you would move exactly in line with SPY. If you then would have sold XLC in the week of 1/24 and kept the 8.4% in cash, you would have outperformed SPY by 20.8% * 8.04% = 1.74%.
Plenty of professional PMs would sign immediately for such a result in 6 months' time!!
Weekly and Daily Rotations Aligning
Let's dive a bit deeper into the Communication Services sector and see if we can get an outlook for the coming weeks.
The rotation on the weekly RRG is very clearly turning back to the lagging quadrant, which suggests that we are about to enter a new leg down in an already existing relative downtrend.
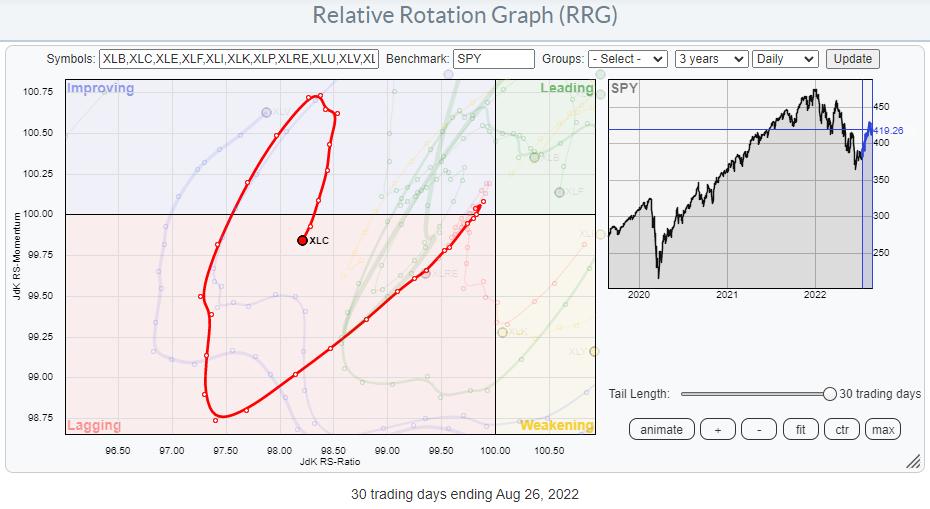
In the daily RRG above, I have highlighted the tail for XLC and, as you can see, it has also turned back down while inside the improving quadrant and has now already hit lagging, leading the way for the weekly tail to follow. This daily rotation is sending the same message as its weekly counterpart. We are embarking on a new leg down within an already falling relative trend.
When both the weekly and the daily RRG are rotating in sync, that usually sends a strong message.
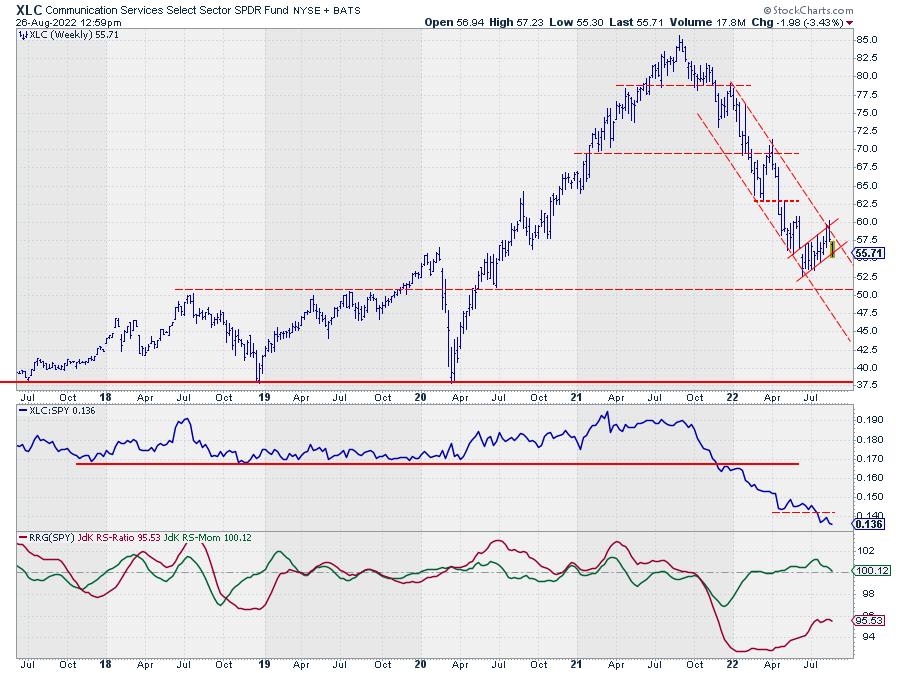
The price chart for XLC confirms that message. The downtrend that started in the middle of last year is still fully intact, showing a very regular series of lower highs and lower lows. The recent improvement ran into resistance at the level of the falling resistance line and is now close to breaking down from that consolidation. Such a move will also help the RS-line to move lower and continue its downtrend by completing a rotation completely on the left-hand side of the RRG for both the weekly and the daily time frames.
XLC - Groups
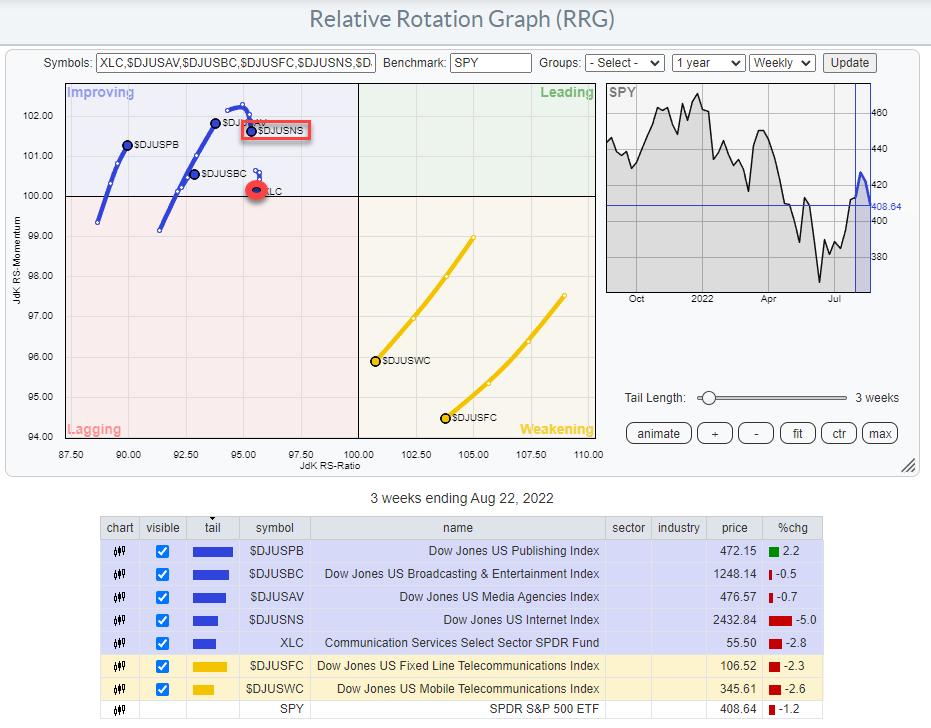
This RRG shows the rotation for the groups inside the Communication Services sector. This is a so called "double benchmark" chart. The center of the chart is $SPX, but you will also find XLC on the chart. This allows you to see the rotation of the groups against the S&P 500, but also against their sector index (XLC) at the same time.
The most important group in this universe is $DJUSNS, the Dow Jones US Internet index.
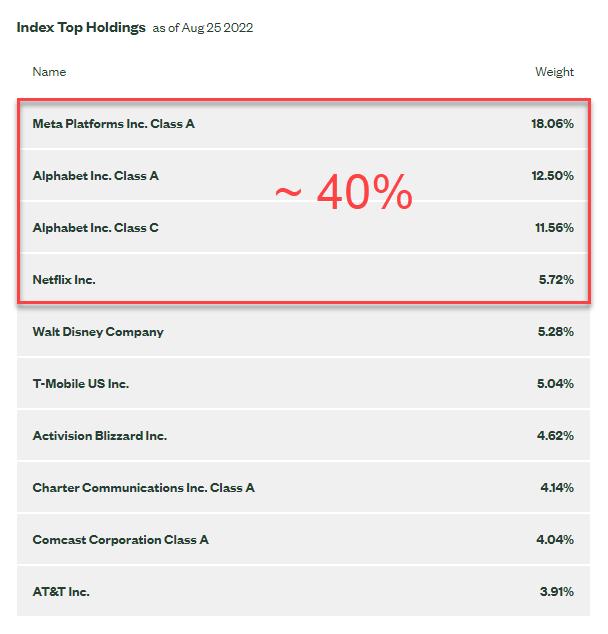
In the composition of the Communication and Services Index, the first four symbols are all in the DJ US Internet Index and they make up almost 40% of the market capitalization of the entire sector. No wonder, as that is an important group which will drive the performance of the entire sector.
When you closely look at the position of $DJUSNS against XLC in the RRG above, you will notice that its tail is inside the improving quadrant (vs. XLC as well) and rotating back down without crossing over the (imaginary) vertical axis that represents the 100-level on the RS-Ratio scale against XLC.
It is pretty clear that, when META and GOOGL break lower, the decline in XLC will start to accelerate again.
META
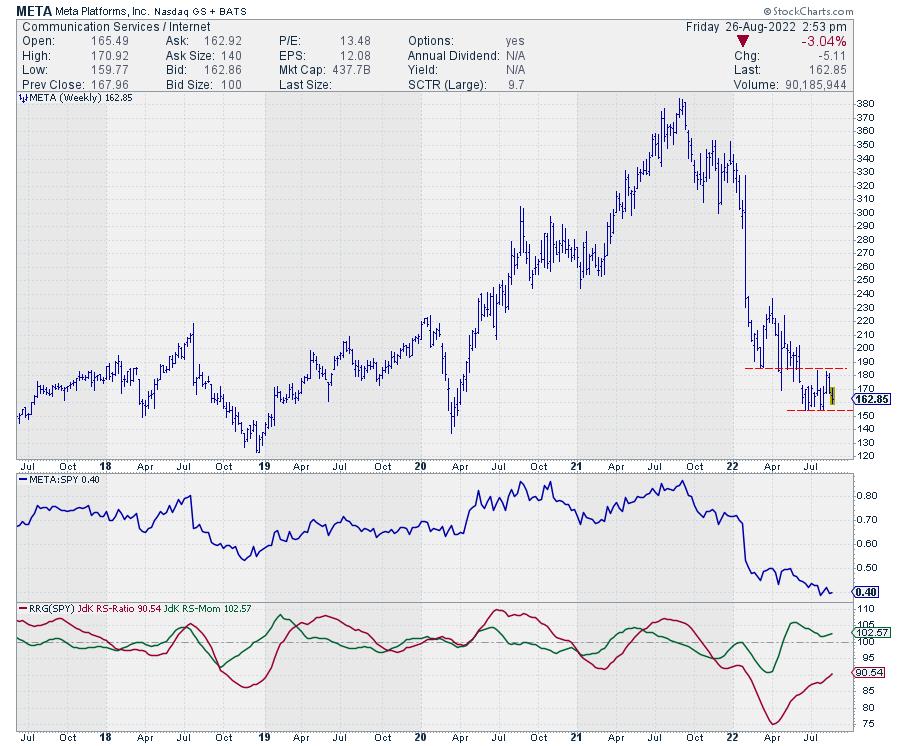
For META, the important support level to watch is around 153-154. When that breaks and META leaves the small consolidation, an acceleration lower may be expected.
GOOGL
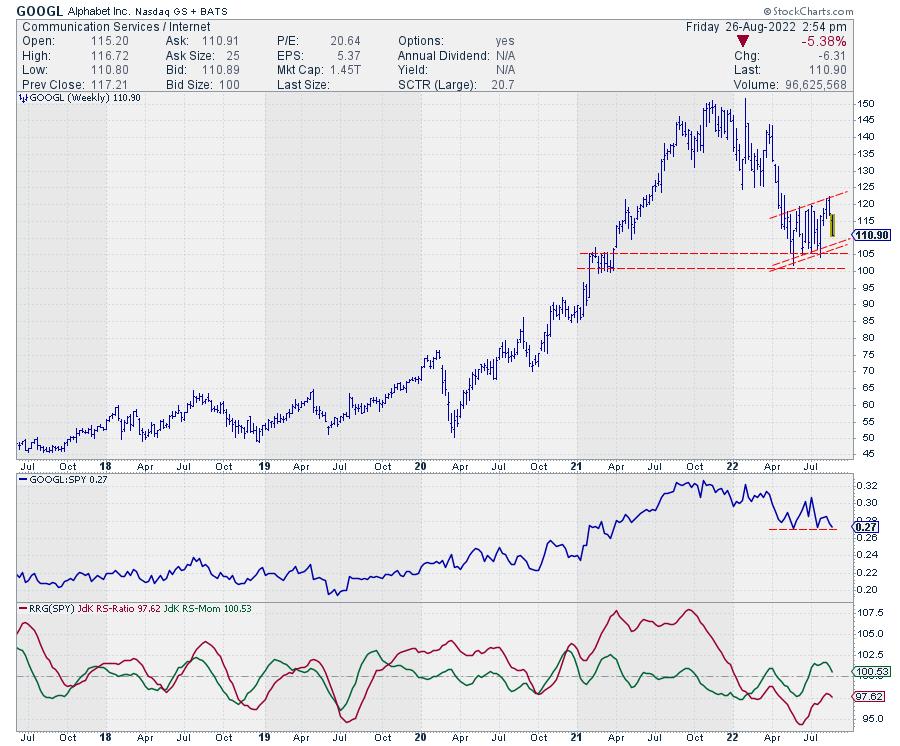
GOOGL is in a slightly rising consolidation, but is having difficulty pushing higher. There is plenty of support on the downside between 100-107.5, but ,when that area of support gives way, it will open up serious downside potential.
All in all, the outlook for this sector remains very weak, and more relative weakness seems to be underway.
#StaySafe, Have a great weekend, --Julius
Julius de Kempenaer
Senior Technical Analyst, StockCharts.com
Creator, Relative Rotation Graphs
Founder, RRG Research
Host of: Sector Spotlight
Please find my handles for social media channels under the Bio below.
Feedback, comments or questions are welcome at Juliusdk@stockcharts.com. I cannot promise to respond to each and every message, but I will certainly read them and, where reasonably possible, use the feedback and comments or answer questions.
To discuss RRG with me on S.C.A.N., tag me using the handle Julius_RRG.
RRG, Relative Rotation Graphs, JdK RS-Ratio, and JdK RS-Momentum are registered trademarks of RRG Research.
