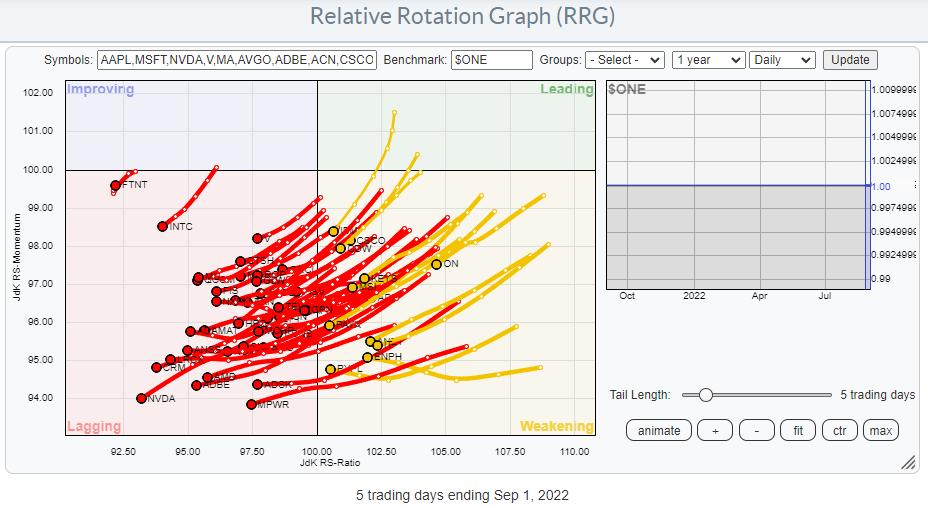
Plotting the components of the Information Technology Sector against $ONE provides us with a sobering picture. Pretty much every single stock in that index is in a downtrend, inside lagging, and/or inside weakening (and very close to entering lagging).
Plotting that same graph on a weekly timeframe shows almost all tails rolling over after an upward move.
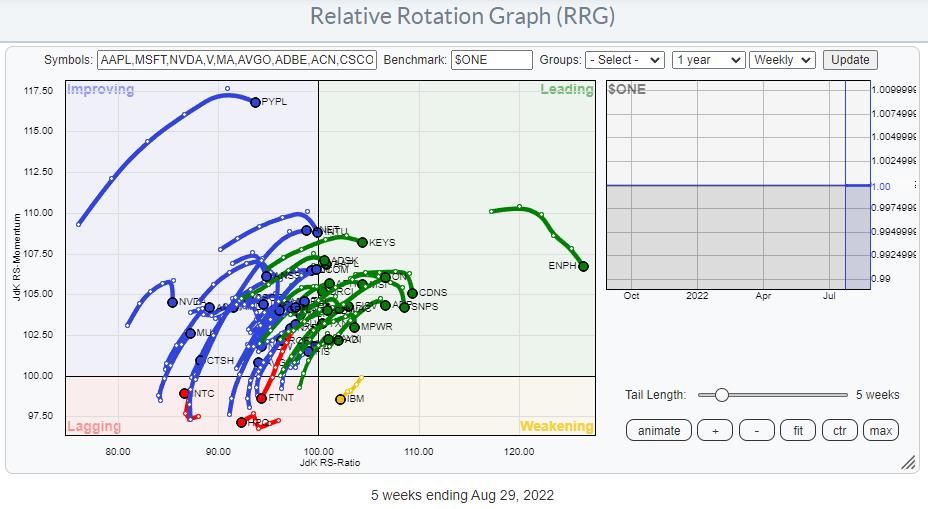
When doing presentations, I often joke about how we don't need to worry about the ticker symbols we cannot read. The tickers that we CAN READ are the interesting ones. Apart from PYPL and ENPH, the symbols that I can read and which are triggering my attention are IBM inside the lagging quadrant and FTNT, INTC and HPQ inside the lagging quadrant.
These are not the locations where you want to be able to read those symbols. These are not small companies.
Obviously, the big names in the sector are AAPL at 25% market-cap and MSFT at 22% market cap. The two Relative Rotation Graphs below show the tails for both stocks against $ONE on weekly and daily timeframes.
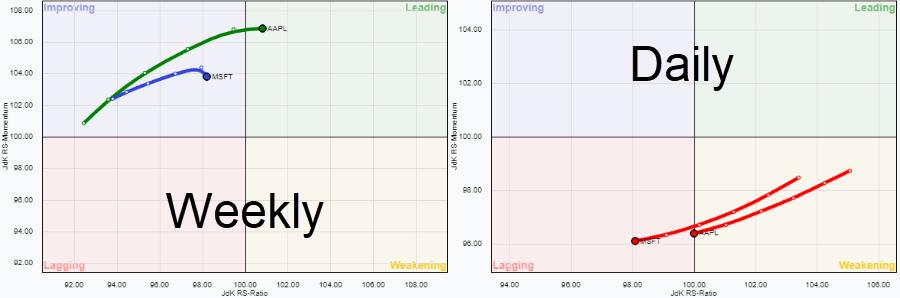
The weekly tails tell us that MSFT has already started to roll over before reaching the leading quadrant, while AAPL did enter leading, but at flat RS-Momentum. On the daily RRG, both are shooting off into the lagging quadrant, which suggests that A) The roll over of MSFT on the weekly RRG is likely to continue and B) AAPL is likely to start rolling over just inside the leading quadrant anytime soon.
With this observation in mind, I want to see the behavior of these two mega-caps from a relative perspective.
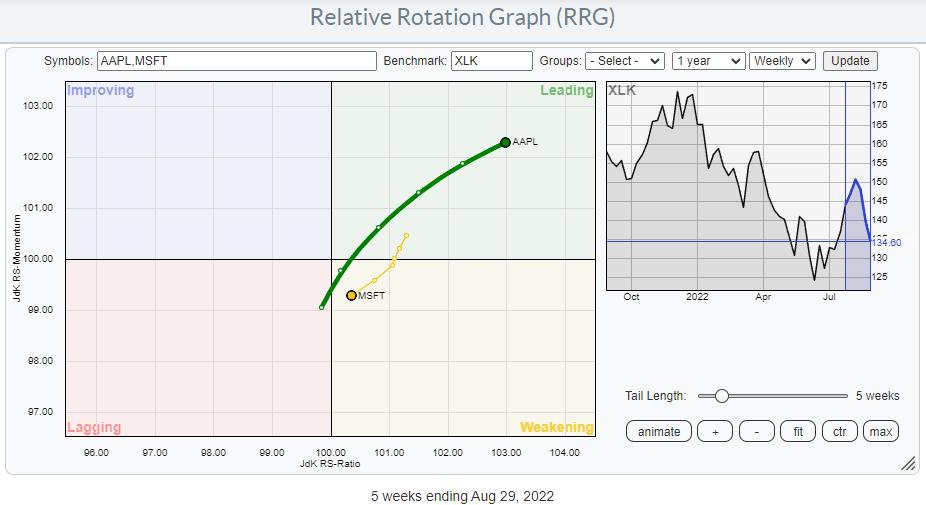
This weekly RRG above perfectly shows the opposite movements for the trails of MSFT and AAPL. AAPL is moving inside and further into the leading quadrant, while MSFT is rotating in opposite direction through the weakening quadrant, but heading towards lagging. This (sort of) balances out the relative behavior of XLK, and it means that the other names in the sector, all much less in terms of market cap than MSFT and AAPL, are dictating the rotation of the XLK tail.
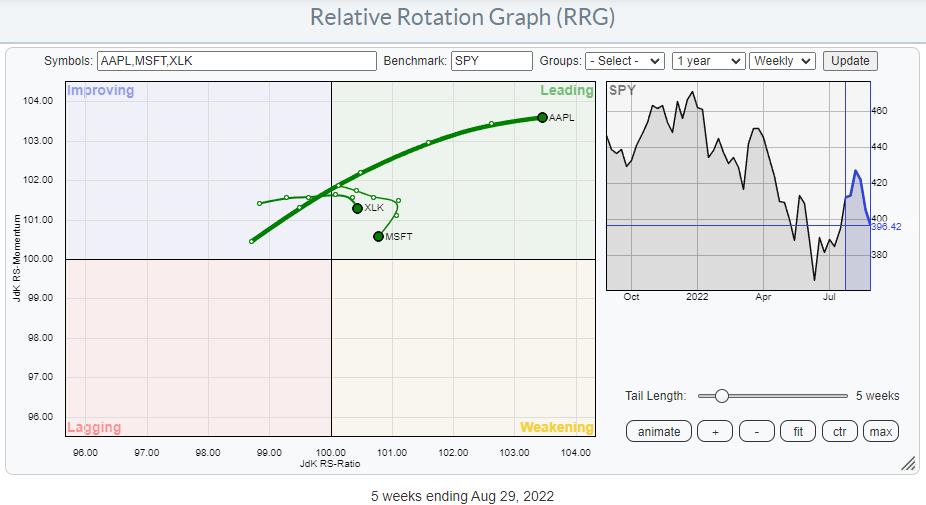
This RRG shows the tails for MSFT and AAPL against SPY, and I have added the XLK tail for reference. The loss of relative momentum is clearly visible for XLK already and driven by MSFT.
What this means is that "As If and When" AAPL starts to deteriorate against SPY/XLK from a relative perspective, we will most likely see a more rapid deterioration for the sector against SPY.
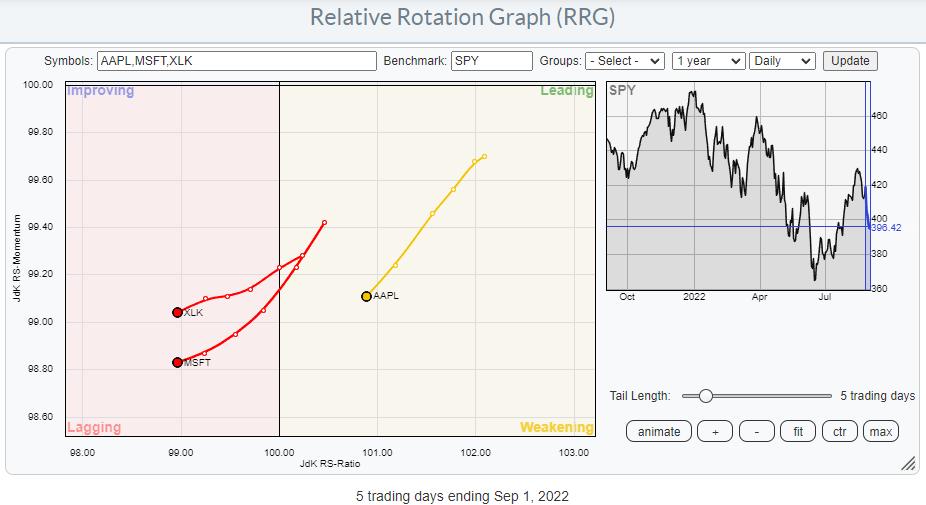
Looking at the daily rotation for this setup, such a move may be around the corner.
MSFT
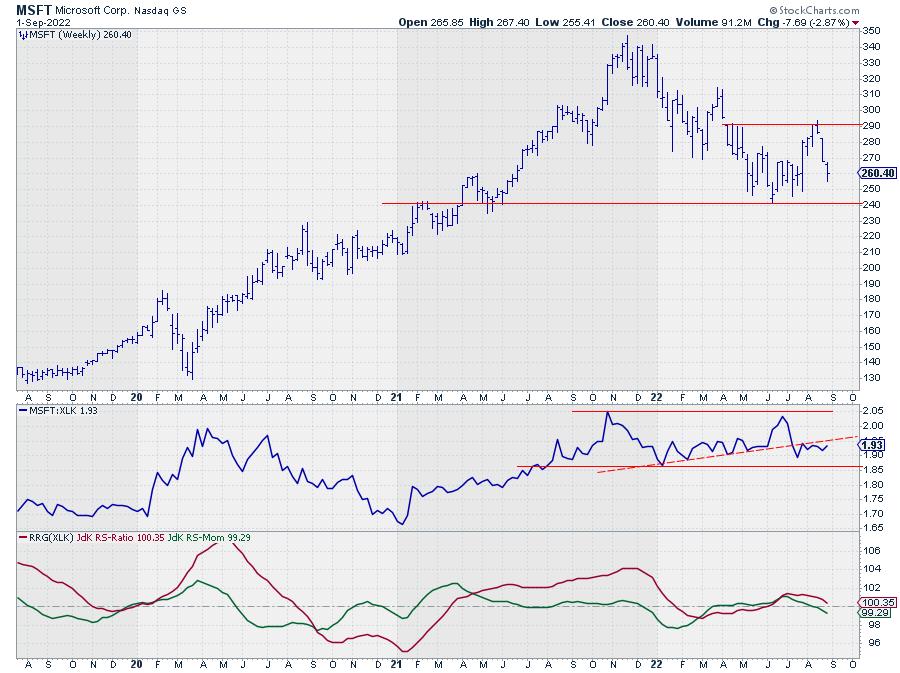
MSFT is on its way to the lower boundary of a trading range between 240-290, and a more or less similar situation is visible in the relative strength line. The RRG lines have slowly started to pick up an emerging downtrend in relative strength for MSFT vs. XLK and both are pointing lower.
AAPL
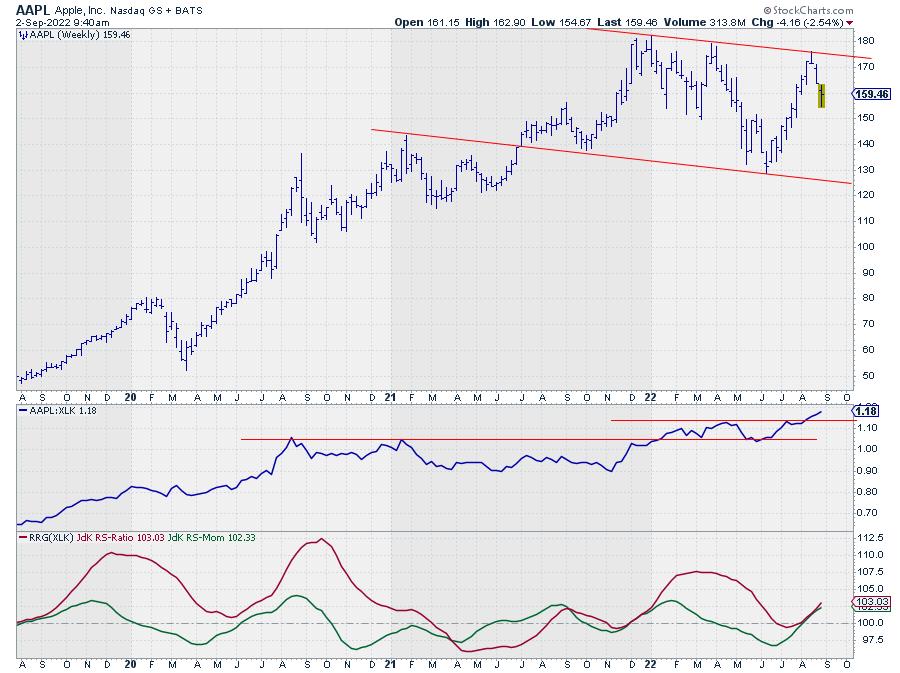
Despite the fact that AAPL is moving in a slightly down-slanting range, its relative strength against XLK is much stronger than for MSFT. This shows in the raw RS-Line, which is breaking above overhead resistance and following through. As a result, both RRG-Lines are moving above 100 and pointing higher at the same rate, which results in the strong RRG-heading that is visible on the graph.
All in all, the biggest risk for the Technology sector at the moment is a deterioration of AAPL. The first important support level to watch is near 150. Once broken, that will open up more downside and very likely drag the sector lower vs the S&P 500.
#StaySafe and Have a great weekend, --Julius
Julius de Kempenaer
Senior Technical Analyst, StockCharts.com
Creator, Relative Rotation Graphs
Founder, RRG Research
Host of: Sector Spotlight
Please find my handles for social media channels under the Bio below.
Feedback, comments or questions are welcome at Juliusdk@stockcharts.com. I cannot promise to respond to each and every message, but I will certainly read them and, where reasonably possible, use the feedback and comments or answer questions.
To discuss RRG with me on S.C.A.N., tag me using the handle Julius_RRG.
RRG, Relative Rotation Graphs, JdK RS-Ratio, and JdK RS-Momentum are registered trademarks of RRG Research.


