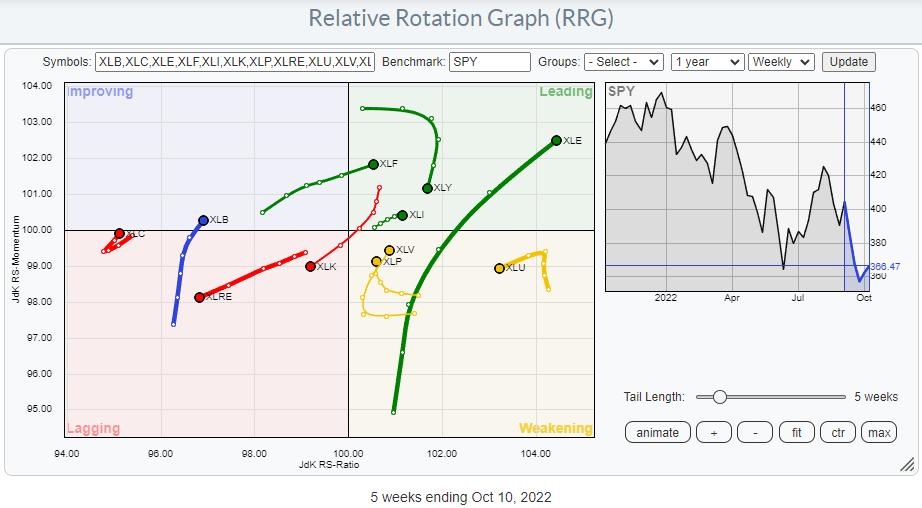
On the weekly Relative Rotation Graph, the tail for XLF has just crossed over into the leading quadrant while keeping up its rising relative momentum. This makes the financials sector one of the leading sectors in the market at the moment.
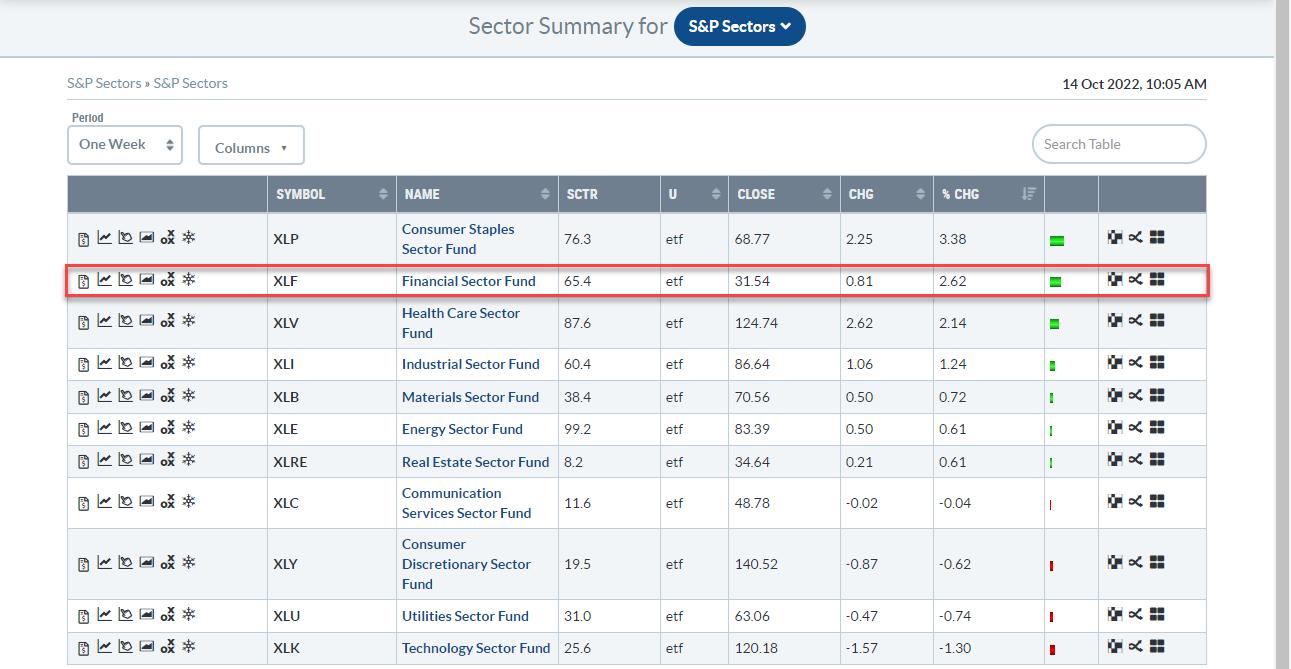
In the past week, XLF picked up 2.62%, making it the second-strongest sector in the S&P 500, which picked up "only" 0.92%. The strongest sector was Consumer Staples, and Health Care came in at no 3. This is interesting as Financials is considered an offensive sector while Staples and Health Care are hard-core defensive sectors.
The RRG below highlights all sectors traveling at a positive RRG-Heading (between 0-90 degrees or North East). The green ovals at the end indicate offensive sectors, which are expected to lead in a strong market ($SPX). Orange are sensitive sectors, while the red ovals are on the defensive sectors that usually lead during weak ($SPX) markets.
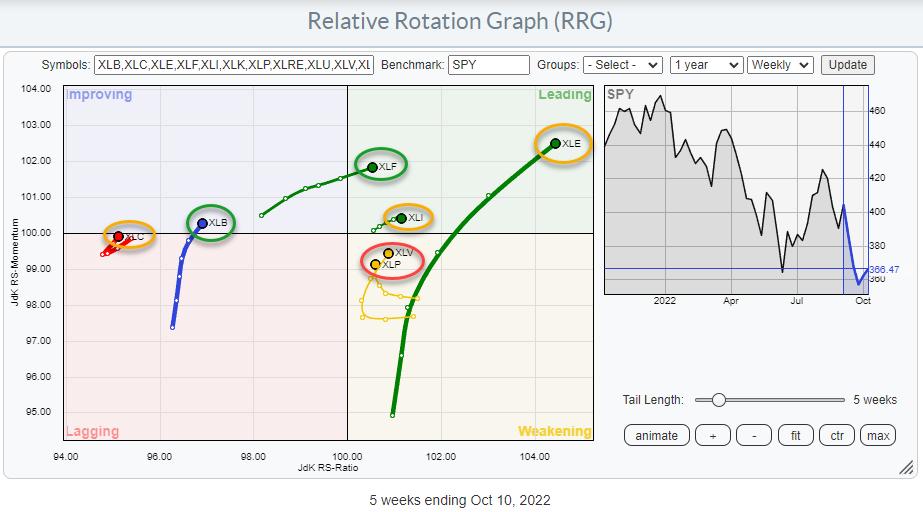
It's interesting to see how mixed that group is. Starting from the right, XLE is the strongest sector, followed by XLI. Both are sensitive sectors. The big difference is the length of the trail on both. Energy obviously has a lot of power behind the move, as it shows the longest tail in the plot. XLI is the opposite, with the shortest tail and a lot less relative momentum.
Health Care and Consumer Staples's tails are curling back towards the leading quadrant while traveling through weakening. Having these sectors still in relative uptrends and showing up at the top of the weekly performance table signals that there is still buying going on in defense. The third defensive sector is missing here, as it is not at a positive RRG-Heading, but, as you can see in the first RRG, XLU is at a high RS-Ratio reading and inside the weakening quadrant, with a good possibility of curling back up before hitting the lagging quadrant.
The only two offensive sectors on this plot are XLF and XLB. XLF obviously strong, but XLB is still at a low RS-Ratio reading while crossing into the improving quadrant. The sensitive Communication Services sector is showing a very similar rotation. XLC and XLB are too low on the RS-Ratio scale to be considered 'leading' in relative trend.
As a result, XLF is the odd one out. And, maybe more importantly, the two heavy-weight sectors, Technology and Consumer Discretionary are not participating.
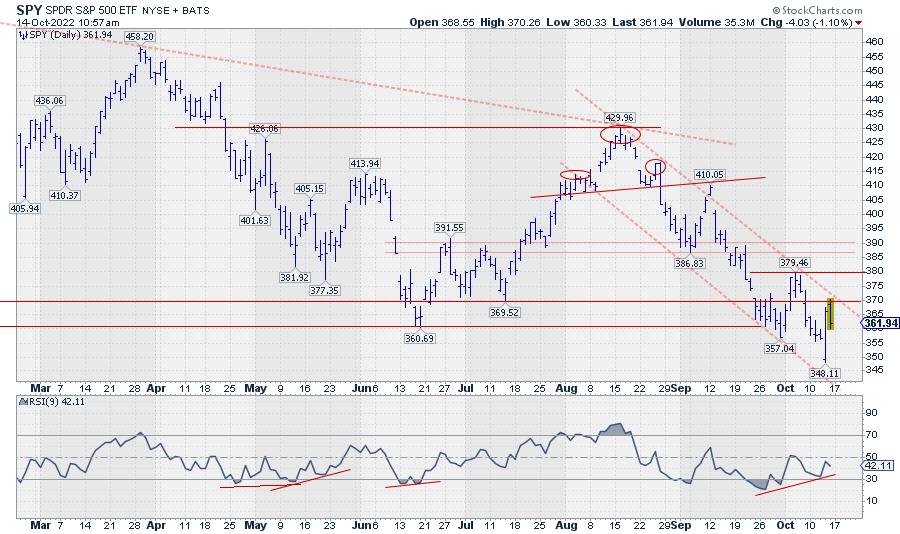
When I look at the chart of the S&P 500 with the above observations in mind, I need to conclude that the downtrend on both the daily and the weekly charts is still intact. The slingshot reversal on Thursday was indeed a nice move but, so far, not really more than that. As I am writing this on Friday morning, SPY touched the upper boundary of the falling channel, then started to retreat again.
Yes, I recognize the strength of the reversal in the form of a bullish engulfing candle and the positive divergence that has built up between the RSI and price. However, both need a trigger to confirm that something underlying has really changed.
I am closely watching two levels that need to get broken, IMHO, for such a confirmation. First is the falling resistance line, which is now coinciding with the horizontal 370-level at the upper boundary of the support zone in which we currently are. Second, and more important, is the last peak at 380. When that can be taken out, we have a completed double bottom after breaking a falling channel supported by positive divergence.
As long as that is not happening, we are still in a downtrend, with the ease of movement to the downside.
#StaySafe and have a great weekend. --Julius
Julius de Kempenaer
Senior Technical Analyst, StockCharts.com
Creator, Relative Rotation Graphs
Founder, RRG Research
Host of: Sector Spotlight
Please find my handles for social media channels under the Bio below.
Feedback, comments or questions are welcome at Juliusdk@stockcharts.com. I cannot promise to respond to each and every message, but I will certainly read them and, where reasonably possible, use the feedback and comments or answer questions.
To discuss RRG with me on S.C.A.N., tag me using the handle Julius_RRG.
RRG, Relative Rotation Graphs, JdK RS-Ratio, and JdK RS-Momentum are registered trademarks of RRG Research.


