EUR/USD Under Pressure From Long-Term Resistance
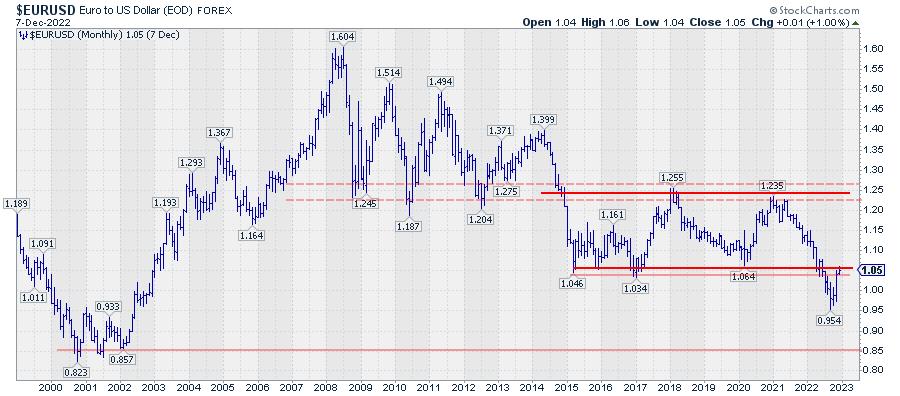
The EUR/USD ($EURUSD) relationship has been under pressure since late 2021, when a peak was set at 1.2350. In a steady downtrend, EUR/USD declined to a recent low of 0.9540. During this decline, a significant support level around 1.05 was broken.
This break caused a serious change in the characteristics of the EUR/USD chart. Until July, the euro moved in a broad trading range against the U.S. dollar. The lows of 2015, 2016, and 2020 marked the lower boundary of that range, around 1.05. The peaks of 2018 and 2020, near 1.25, marked the upper edge. Going back in time, you can see how this upper boundary/resistance area had served as support between 2008–2014.
The recent break below the significant horizontal support area around 1.05, imho, can be compared with the break of support at the end of 2014, when EUR/USD sank below the area around 1.25.
The recent rally out of the August low is the first recovery rally since the start of the decline from 1.15. The former support zone near 1.05 is expected, and already starting to serve as a massive overhead resistance level.
Short-Term Rotation Gaining Strength
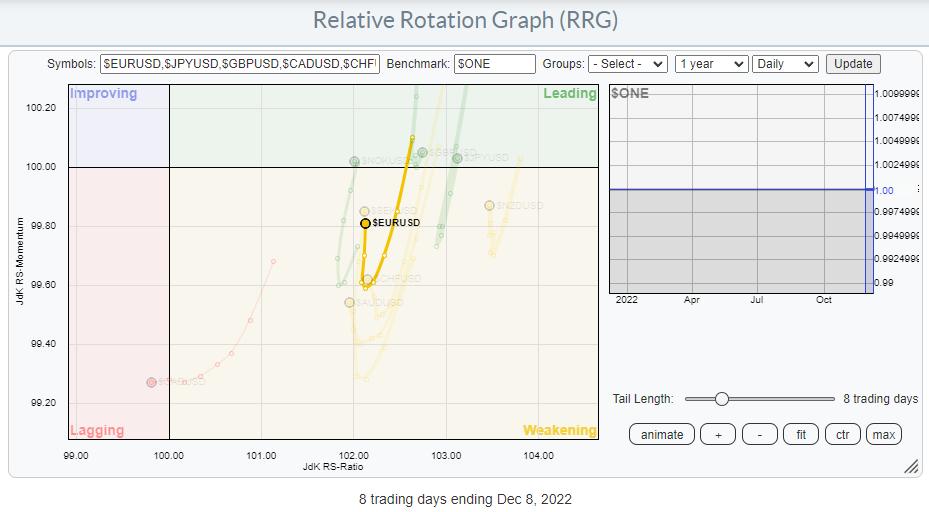
Looking at the relationships of all G10 currencies on a daily Relative Rotation Graph shows the $EURUSD inside the weakening quadrant, but turning back up toward leading, suggesting that a new period of U.S. dollar weakness is underway. And given the majority of the moves on the monthly chart and the broad support and resistance zones, that is very possible.
This situation is an excellent example of why it is always important to be aware of the bigger picture and look beyond what is right in front of you. The direct translation of a Dutch proverb would be, "You need to look beyond the length of your nose."
Putting Price Action Into Perspective
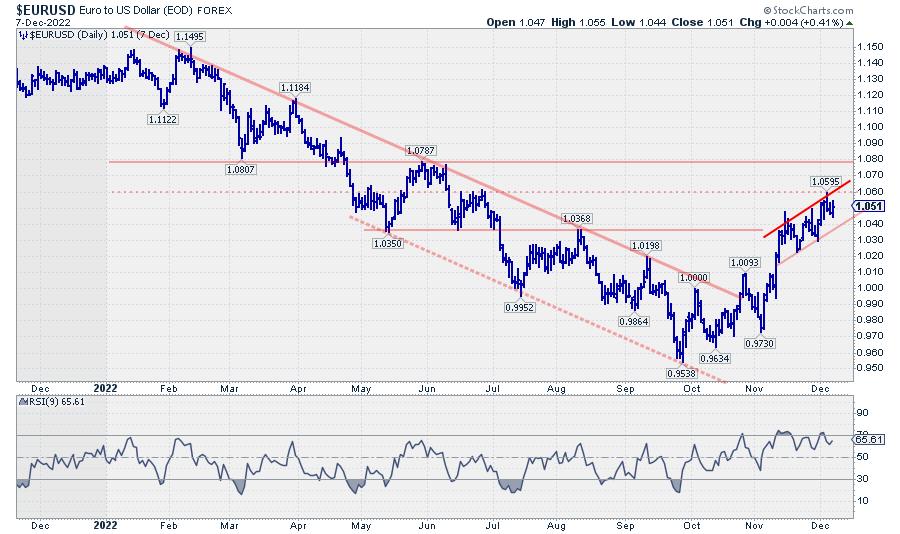
It's easy to read this daily chart of EUR/USD from a bullish perspective. "A long winding downtrend was recently reversed, and a new uptrend—higher highs, and higher lows—is underway. The market is now approaching some overhead resistance at 1.06, then 1.08, etc..."
Knowing what is going on on that monthly chart, I am now reading the developments on the daily chart and the above daily RRG very differently.
The recent rally is the first recovery rally after a long period of falling EUR/USD rates, and this rally is now nearing a major resistance area, which lies around 1.05 but could even be stretched to 1.08. After the initial strength, the rate of change has already started to drop, signaling the first signs of fatigue for this move.
In the bigger scheme of things, that means that the upside potential for EUR/USD is somewhere between 0.01–0.03, while the downside risk, back towards the recent low at 0.95, is 0.10.
Surely, short-term traders will have plenty of opportunities to trade the move up with tight stops. But investors with a longer-term horizon or U.S.-based investors investing in overseas securities need to be aware of this longer-term picture.
Looking Outside of the US
The Relative Rotation Graph for international markets is a good starting point to find opportunities outside the U.S. market.
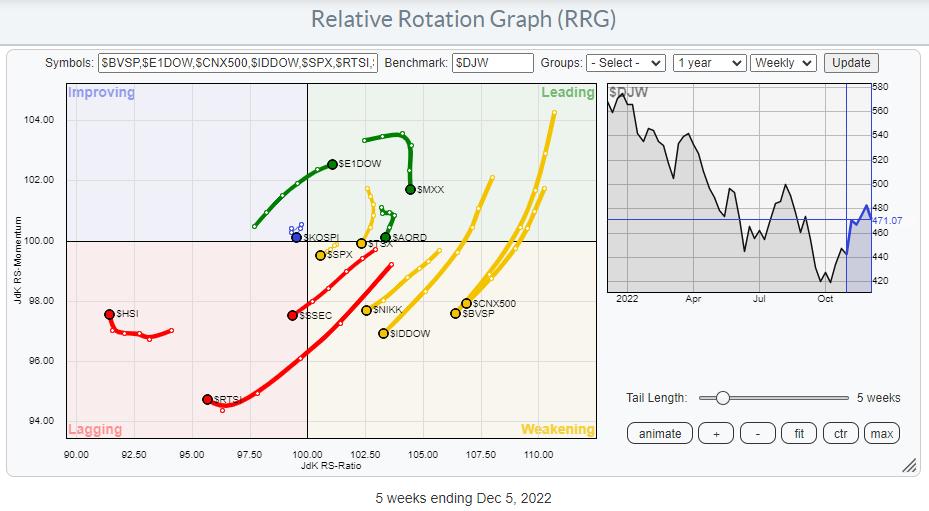
This RRG shows how most international markets deteriorate against the DJ World index. The DJ Europe index, however, is showing strength and pushing into the leading quadrant. This opposite rotation becomes clearer when you zoom in on the tails for Europe and the U.S.
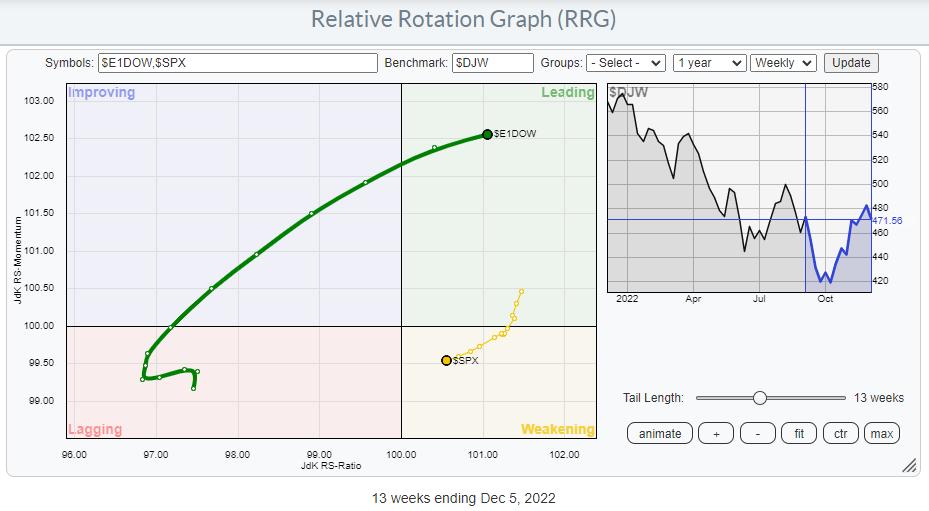
The strength in favor of Europe over the U.S. is visible, with the power of the move in Europe reflected in the length of the tail vs. the length of the tail on the S&P 500 Index ($SPX).
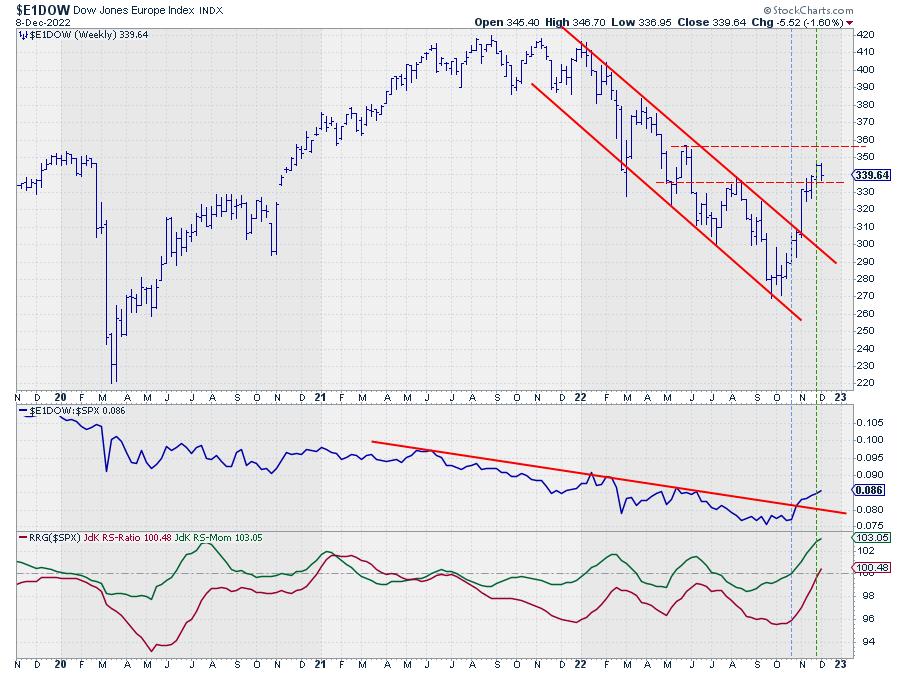
The direct comparison between the U.S. and Europe on the chart above shows the same information as on the RRG in another 1-1 format.
We know the chart of $SPX is pushing against resistance coming off that falling resistance line from the peak at the start of the year. $E1DOW has had a similar falling resistance line since the beginning of the year (see chart above), with even more touchpoints than $SPX. However, the upward break in Europe is very visible, and this is now dragging the relative strength against $SPX up and out of its relative downtrend.
Towards the end of the year and most likely going into the new year, the message is clear: "Europe beats the US."
#StaySafe and Have a great weekend, --Julius
Julius de Kempenaer
Senior Technical Analyst, StockCharts.com
Creator, Relative Rotation Graphs
Founder, RRG Research
Host of: Sector Spotlight
Please find my handles for social media channels under the Bio below.
Feedback, comments or questions are welcome at Juliusdk@stockcharts.com. I cannot promise to respond to each and every message, but I will certainly read them and, where reasonably possible, use the feedback and comments or answer questions.
To discuss RRG with me on S.C.A.N., tag me using the handle Julius_RRG.
RRG, Relative Rotation Graphs, JdK RS-Ratio, and JdK RS-Momentum are registered trademarks of RRG Research.


