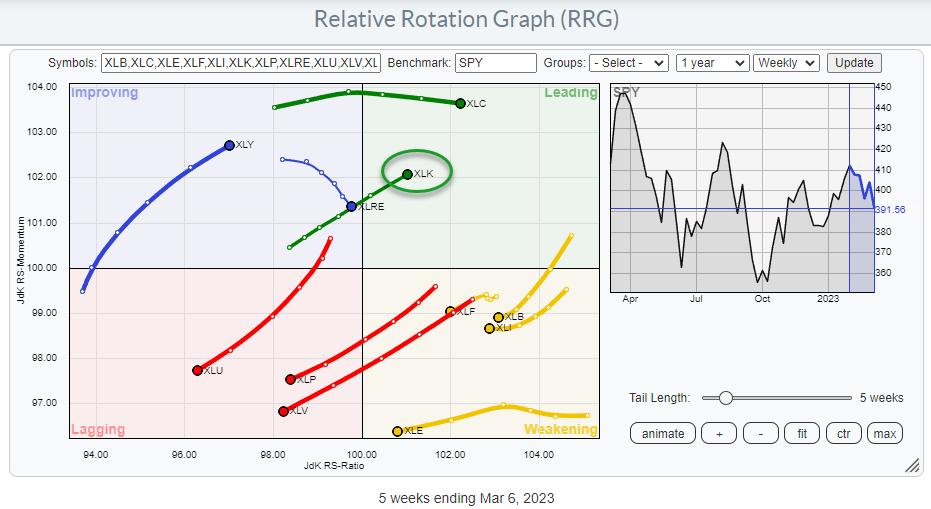
Right now, it seems the most enticing tail on the relative rotation graph for US sectors is that of XLK, the technology sector. XLK has been in a strong RRG heading for a few weeks already, crossing over into the leading quadrant last week, and has continued to push further this week.
Compared to the other "stronger looking" tails on the plot, XLK stands out, as it is one of only two sectors inside the leading quadrant and one of only three sectors on a strong RRG-Heading (0-90 degrees).
As always, the proof is in the pudding.
Daily Rotation Confirms XLK Strength
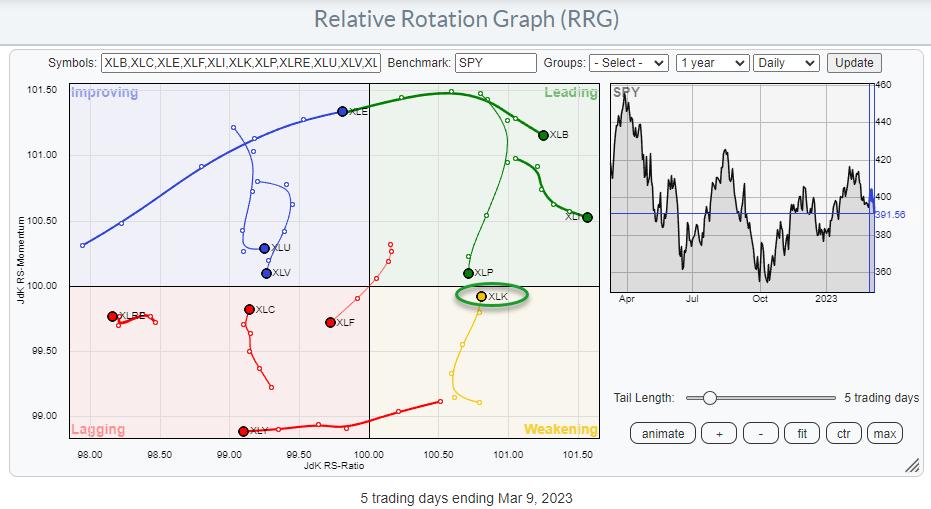
The second RRG shows the rotation for US sectors on the daily timeframe. Here, we find XLK inside the weakening quadrant, but rotating back towards the leading quadrant after a corrective cycle. This combination of tails makes XLK, the Information Technology sector, one of the strongest sectors in the universe at the moment.
SPY Losing Some Momentum
All of this is happening as the S&P 500 loses some of its recently acquired strength.
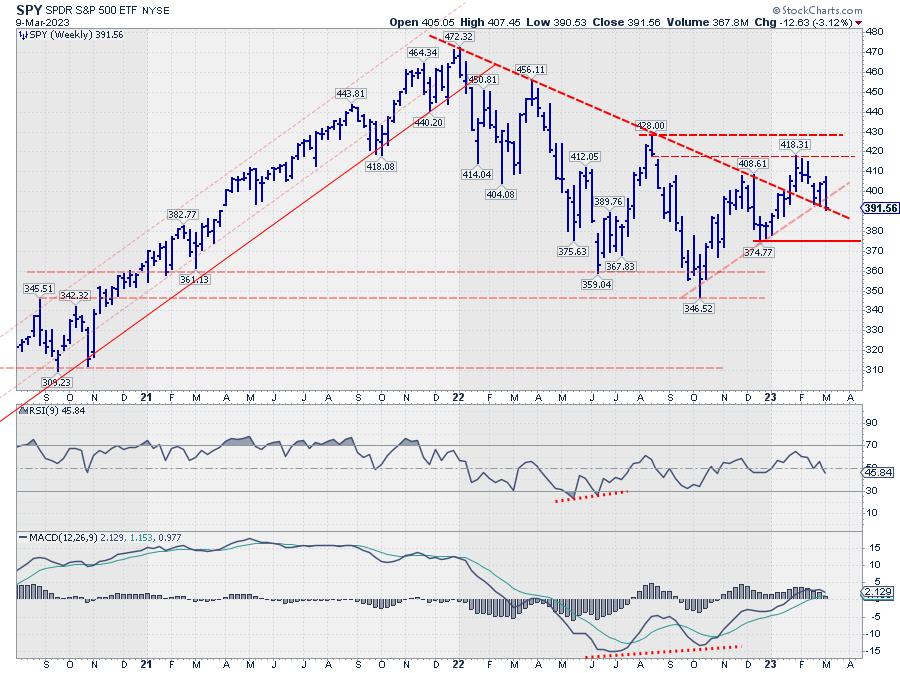
After holding just above the rising trendline, the S&P 500 now seems to be breaking lower and only just holding up above the former falling resistance line, now support, coming down from the late 2021 high.
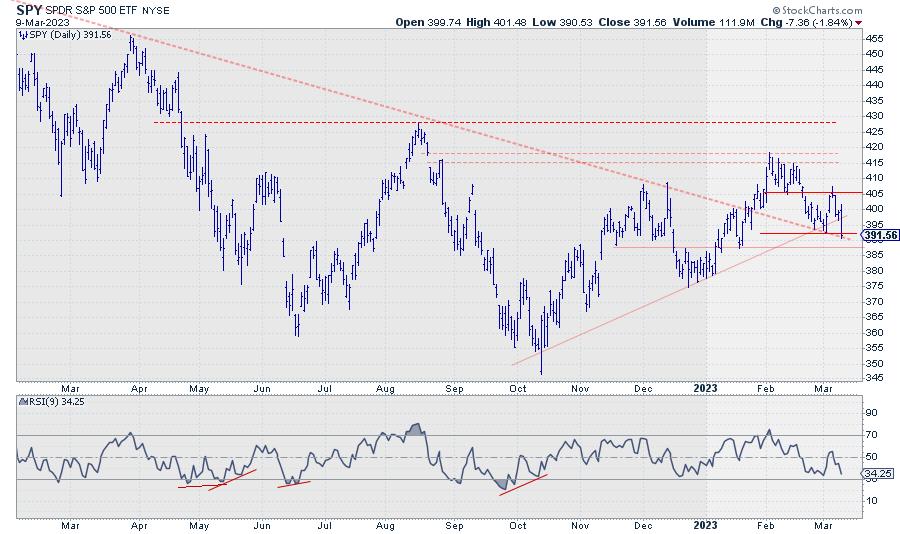
This price action can be seen in more detail on the daily chart above, where a break of the previous low is now visible. The close at the end of Friday's trading session will probably tell us whether we are facing a real and clear-cut break lower, which will most likely push the market down to its next support level near 375, or if we will remain around current levels and stay in the doldrums for a bit longer.
Technology Remains on Track
Whatever the outcome, the rotation of the technology sector will, most likely, remain on track for further improvement in the coming weeks.
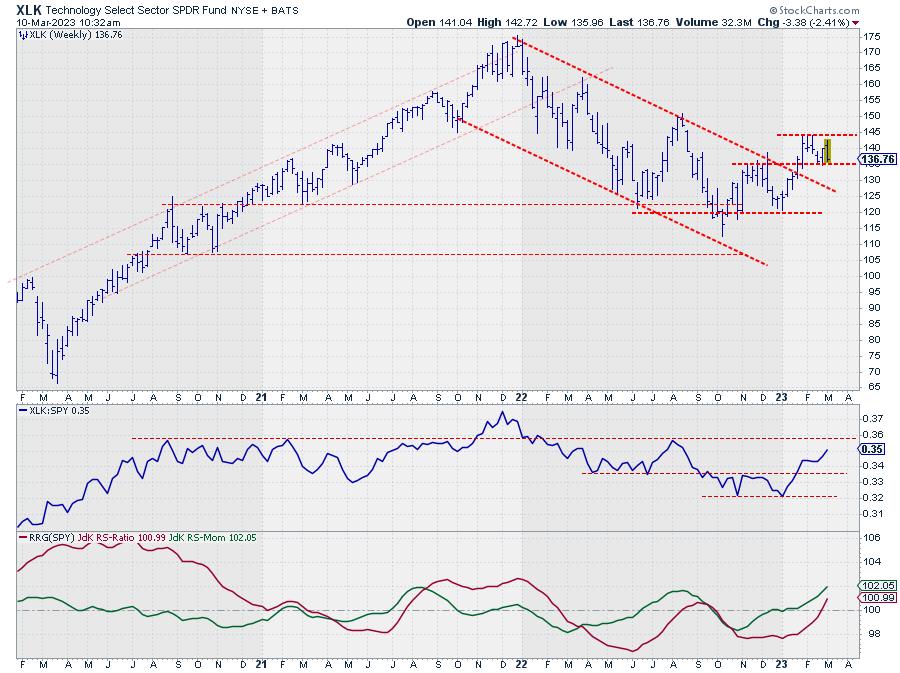
Since breaking out of the falling channel almost two months ago, XLK is holding up well above its newly established support level, near 135. Breaking above the recent high at 145 would confirm 135 as a new higher low and signal a continuation of the uptrend. In case that does not happen and XLK drops further, there is support showing up at the level of the old falling resistance line, now support, and at the level of the previous low, near 120. This will give XLK ample room to maneuver and form a larger base, from which the sector can rise further.
From a relative perspective, things are certainly looking strong. The raw RS-Line has completed a double bottom and is now underway to a horizontal level around 0.35, where the RS-Line has peaked a few times in the past. All this has pushed both RRG lines above 100 and, therefore, the XLK tail into the leading quadrant, where it continues to gain on both axes.
Breaking Tech Down in Industries
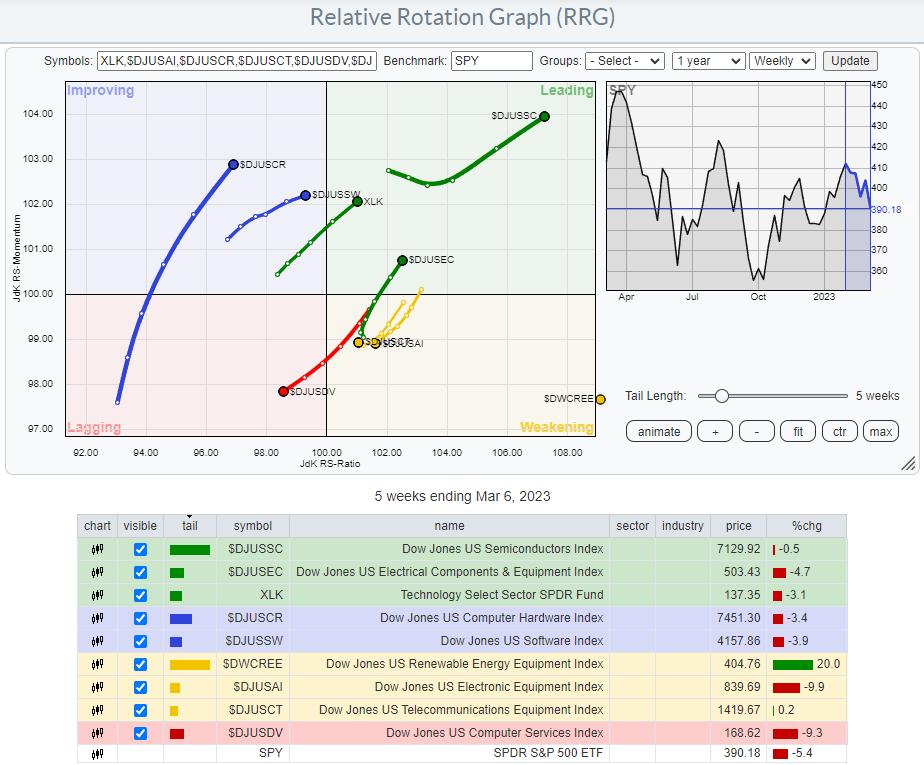
The RRG above shows the industries inside the technology sector against SPY as the benchmark. It is clear and expected that most groups are moving at a strong RRG heading and on track to outperform SPY. This RRG also makes it very clear which groups inside tech are better avoided now. These are Electronic Equipment, Telecommunications Equipment, and Computer Services.
When we change the benchmark to XLK, the rotational picture changes.
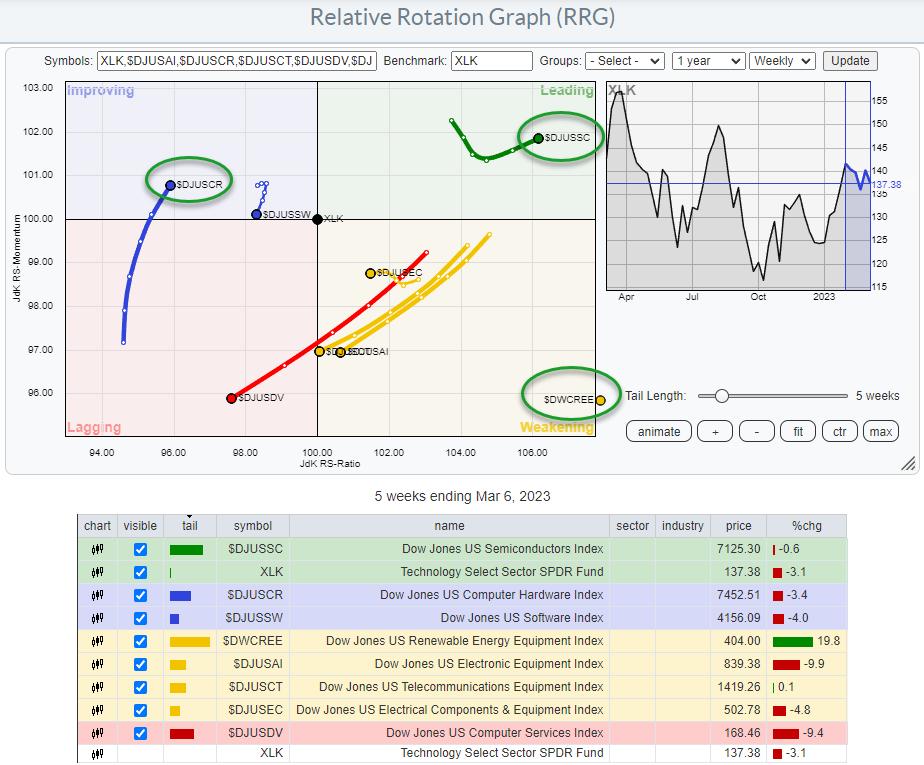
It's now become clear that the strongest groups are Renewable Energy Equipment, positioned in the lower right corner and (not visible in this image) rotating back up towards leading, and Semiconductors, firmly positioned inside the leading quadrant and picking up pace again on both scales after a short dip in relative momentum. When you click the image, the live RRG will open, and you can toggle through the groups to see which are the ones heading rapidly toward the lagging quadrant.
The computer hardware group has just moved into the improving quadrant and is starting to pick up relative strength, moving right on the JdK RS-Ratio scale as well.
All in all, the technology sector remains well on track for further outperformance with a focus on Renewable Energy Equipment, Semiconductors, and Computer Hardware.
#StayAlert and have a great weekend, --Julius
Julius de Kempenaer
Senior Technical Analyst, StockCharts.com
Creator, Relative Rotation Graphs
Founder, RRG Research
Host of: Sector Spotlight
Please find my handles for social media channels under the Bio below.
Feedback, comments or questions are welcome at Juliusdk@stockcharts.com. I cannot promise to respond to each and every message, but I will certainly read them and, where reasonably possible, use the feedback and comments or answer questions.
To discuss RRG with me on S.C.A.N., tag me using the handle Julius_RRG.
RRG, Relative Rotation Graphs, JdK RS-Ratio, and JdK RS-Momentum are registered trademarks of RRG Research.


