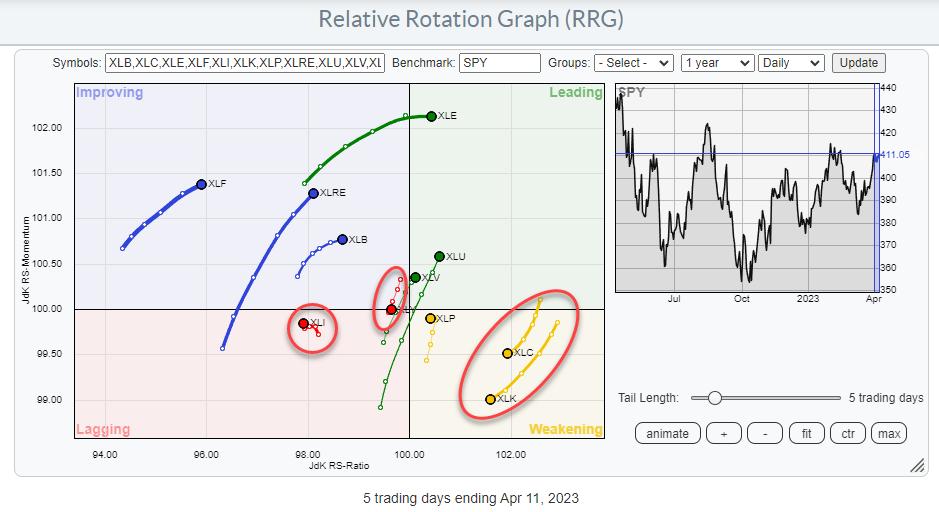
The daily RRG for US sectors is showing an interesting picture. Out of all eleven sectors, only four are on a negative trajectory.
Industrials is inside the lagging quadrant at a very short tail, and more or less in a static position, which means that the sector is in a stable relative downtrend. Consumer Discretionary is very close to the benchmark and crossing over into lagging after it rotated through improving, but was not able to make it over to leading. And the two most important sectors at the moment, Communication Services and Technology, are rotating through weakening after they have led the dance over the last few weeks.
When we break down the sector landscape into offensive, defensive, and sensitive we get a more granular picture.
Offensive:
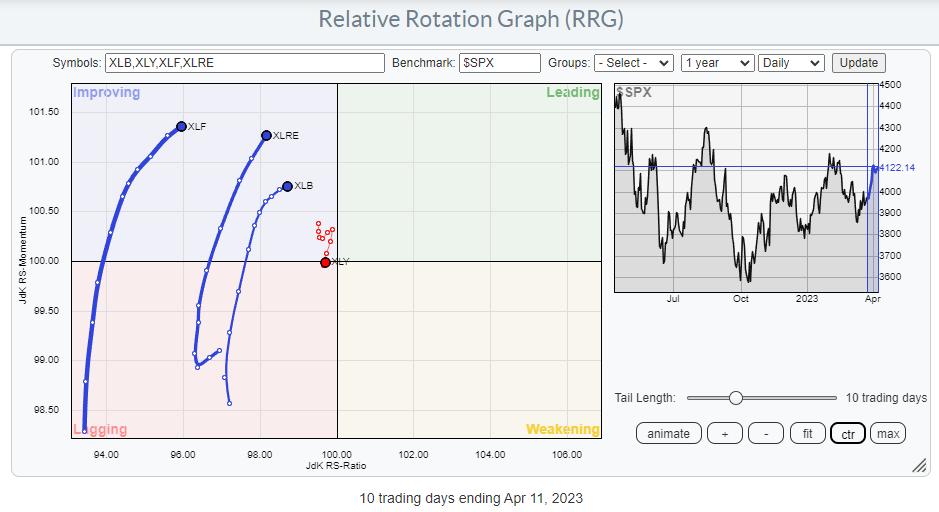
Except for XLY, the offensive sectors are all inside the improving quadrant at long tails, and they are starting to pick up relative strength, i.e. moving higher on the JdK RS-Ratio scale. This type of rotation is supportive for a rise in broad market indices like the S&P 500.
Defensive:
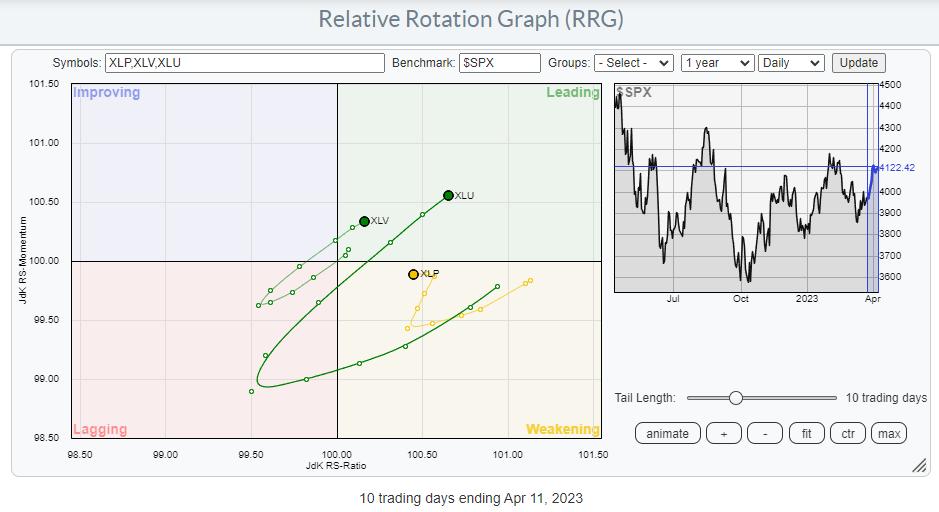
The group of defensive stocks is showing an even stronger rotation. Healthcare and Utilities have made it into the leading quadrant, while Consumer Staples is inside weakening, but moving back up to leading after a rotation lower since late March. Such a rotation to defense is usually a sign of weakness in the general market.
The fact that both the offensive and the defensive sectors are generally showing a strong rotation, with the only one not playing along being Consumer Discretionary, is sending mixed signals with regard to the outlook for the S&P 500.
Sensitive:
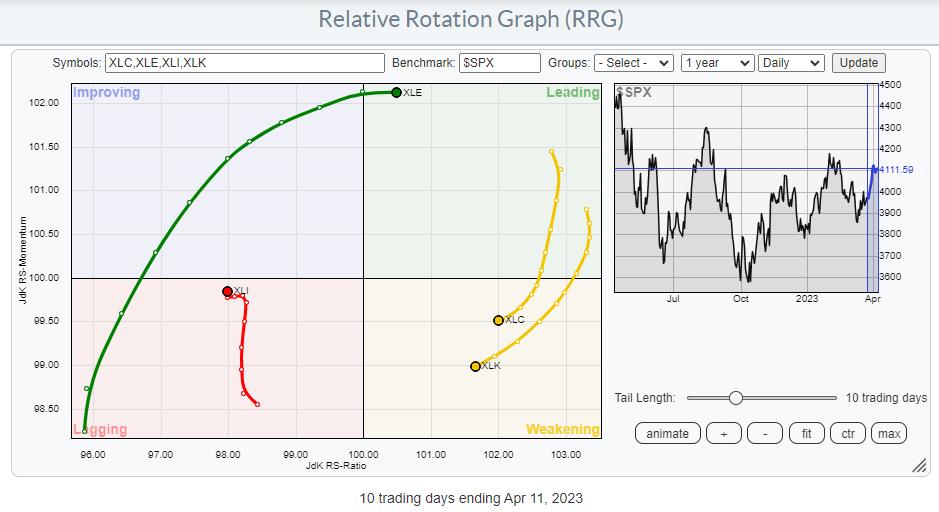
The RRG that holds the group of sensitive sectors confirms that mixed image. Communication Services and Technology are rotating out of favor, while Energy and, to a lesser degree, Industrials are picking up steam.
The overall "problem" here is that the sectors that are on a weaker rotational trajectory are a few of the more important (read heavyweight) sectors. XLK : 26%, XLY: 10%, XLC: 8%.
However, the "good news," if you wish, is that discretionary is no longer the second sector in the universe. As a result of price changes and rebalancing, XLY is now only the fourth sector in terms of market capitalization at a little below 10%. Just to remind you, it used to be around 13%. Healthcare is now the second sector at 15%, while Financials come in third at almost 13%. So the weakness in XLC (8%), XLK (27%), and XLY (10%) is now adding up to around 44% of the market cap. Still a big chunk, but way less than it used to be. This means that it is easier for the other sectors, which are on a positive rotation, to offset this drag.
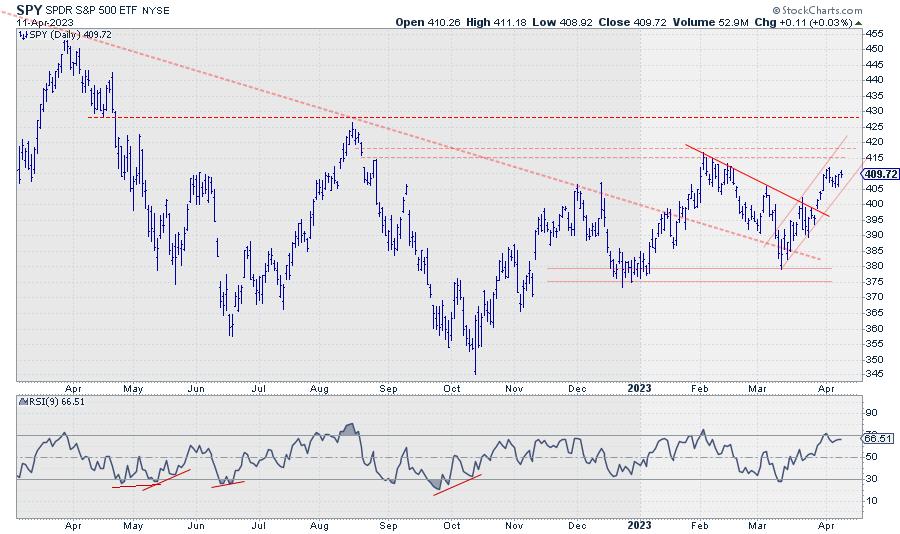
With the S&P 500 struggling to really pick up steam after breaking from the Feb-March correction, it is now important to start seeing broader participation for the current rally to become more sustainable. In order for this to happen, I am primarily watching the charts for XLC and XLK.
Communication Services:
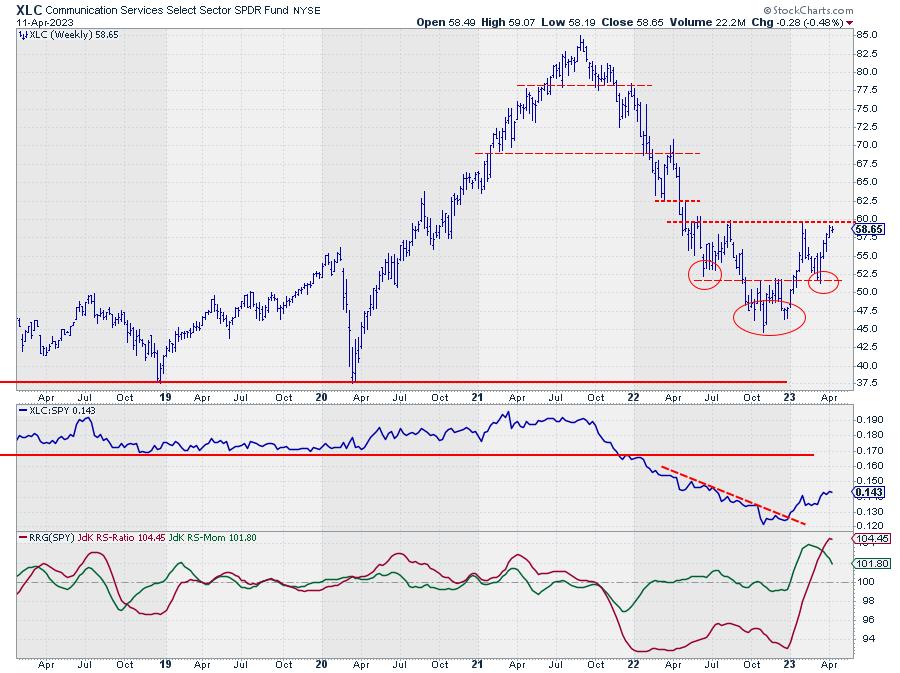
XLC is currently running into resistance just below 60. That horizontal barrier looks to be the neckline of a massive reverse-H&S formation that formed in Q2-2023. If and when XLC can break above that neckline, say $60, an enormous amount of upside potential will be unlocked.
Based on that formation, a (conservative) target price can be calculated at around $70. I'd say that is a very tradable opportunity where the downside is well protected at the level of the neckline once broken. Such a move will certainly contribute to the performance of the S&P 500.
Technology:
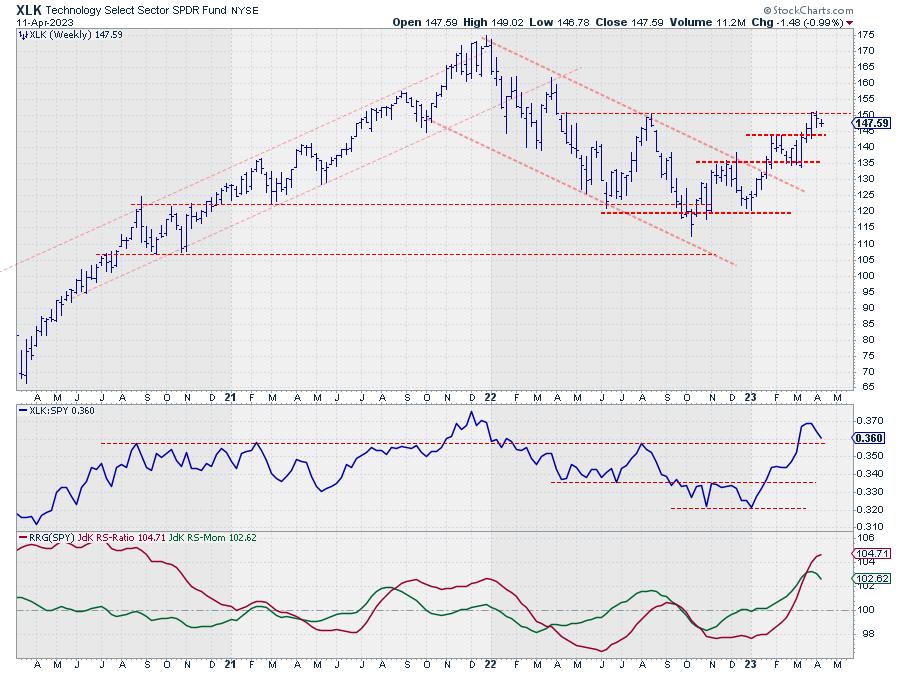
Technology just failed at the level of its overhead resistance near 150. As long as XLK remains above its last low at 135, but preferably above 143, the outlook remains positive. But we do need to see a break above 150 in the coming weeks to keep up the momentum and help push $SPX higher.
#StayAlert, --Julius
Julius de Kempenaer
Senior Technical Analyst, StockCharts.com
Creator, Relative Rotation Graphs
Founder, RRG Research
Host of: Sector Spotlight
Please find my handles for social media channels under the Bio below.
Feedback, comments or questions are welcome at Juliusdk@stockcharts.com. I cannot promise to respond to each and every message, but I will certainly read them and, where reasonably possible, use the feedback and comments or answer questions.
To discuss RRG with me on S.C.A.N., tag me using the handle Julius_RRG.
RRG, Relative Rotation Graphs, JdK RS-Ratio, and JdK RS-Momentum are registered trademarks of RRG Research.


