TAKEAWAYS
- Rotation continues in favor of growth
- Large Cap Segments Generally Beating Value
- Small-Cap Value Stocks Stand Out
Growth, Value, Size
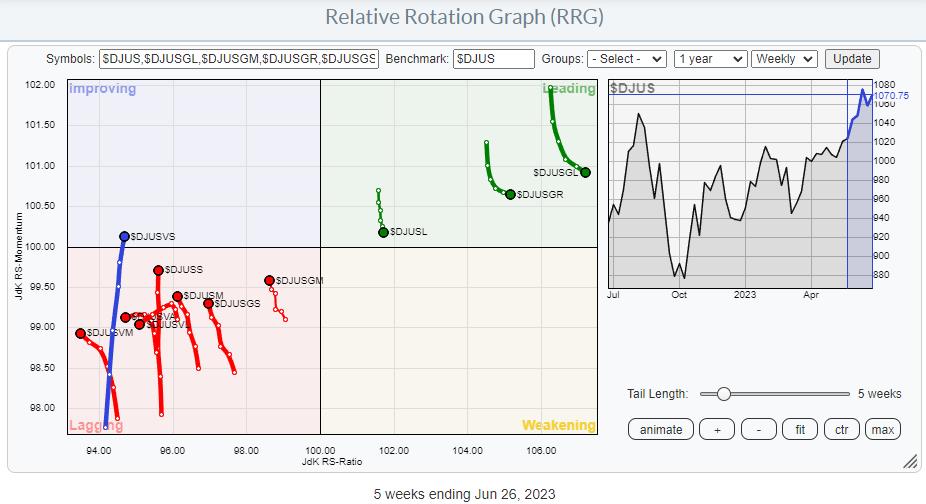
It has been a while since I addressed the rotations of Growth vs. Value and their different size variations. The RRG above shows these rotations on the weekly timeframe.
My first observation is the limited number of tails inside the leading quadrant and the big cluster inside lagging, with tails pointing in more or less opposite directions. And, of course, the lone ranger which is just entering the improving quadrant.
The immediate takeaway from this observation is that large-cap stocks have been leading the market higher over the last few months. The tails inside the leading quadrant are "Large-Cap," "Growth," and "Large-Cap Growth." Nothing new here.
What we currently see is that these tails recently have started to lose some relative momentum, which was picked up on the other side by almost all other indexes on the plot. The interesting thing is that, despite the loss of relative momentum, these stocks hardly lost any relative strength, remaining at roughly the same RS-Ratio readings and even gaining a bit. This serves to underscore that they are still in strong relative uptrends vs $DJUS (Dow Jones US Index).
In order to get a better handle on these rotations, I am going to separate them into three different RRGs.
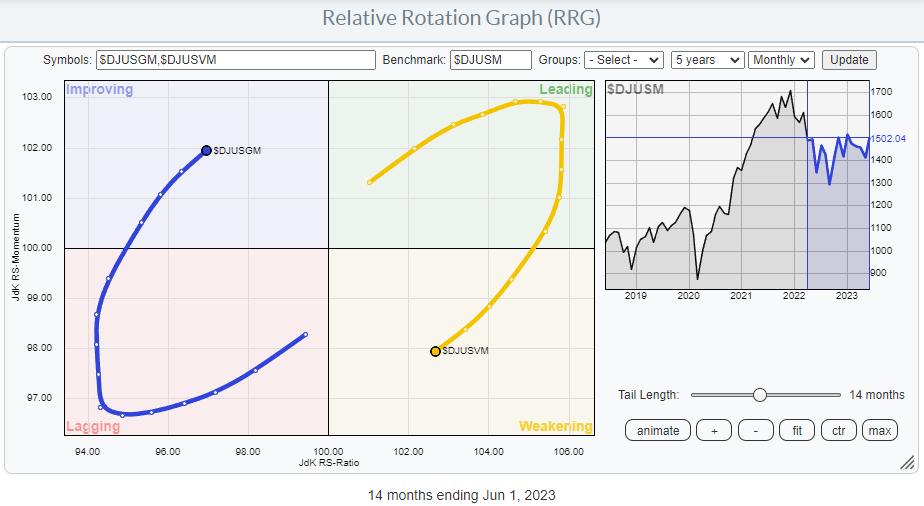
Large Cap: Growth - Value
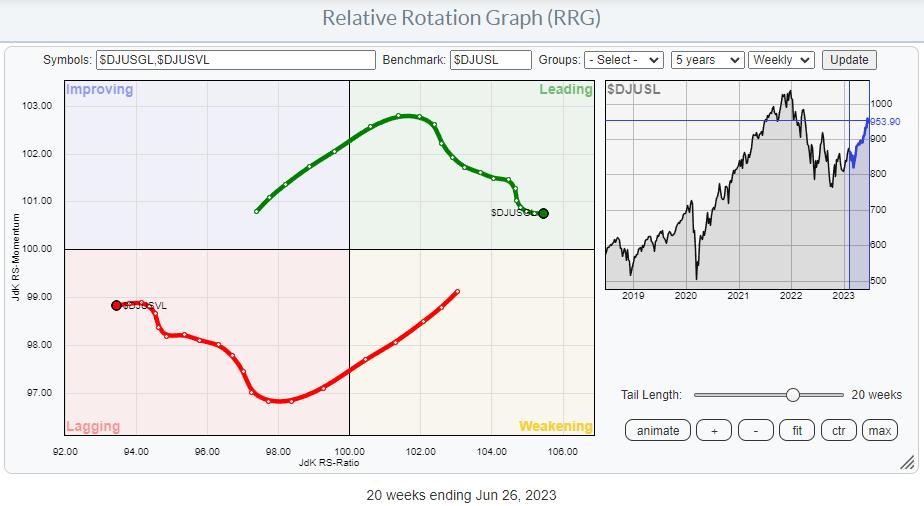
This RRG shows the rotation of Growth vs. Value for Large Cap stocks. The benchmark is The Dow Jones Large Cap index. So this is a closed universe.
With growth on the right and moving higher on the RS-Ratio scale and Value moving in the opposite direction, this is clearly pointing to a continued preference for growth stocks over value. Despite the loss of relative momentum since the beginning of April, Growth has managed to rise 17.7%, while Value picked up only 4.3%. This is a good example of a relative trend producing continued outperformance while losing relative momentum.
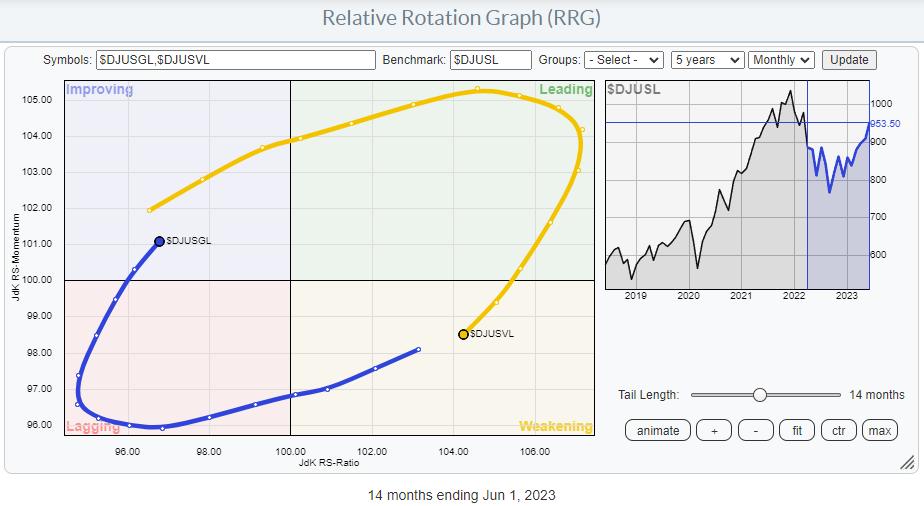
The monthly RRG for this relationship shows the Large Cap Growth tail entering the improving quadrant, while Value has moved into the weakening quadrant on the other side. The combination of these weekly and monthly tails suggests that there is more upside potential left for growth stocks in terms of relative strength, and that the recent loss of momentum on the weekly RRG should be seen as temporary.
Mid-Cap: Growth - Value
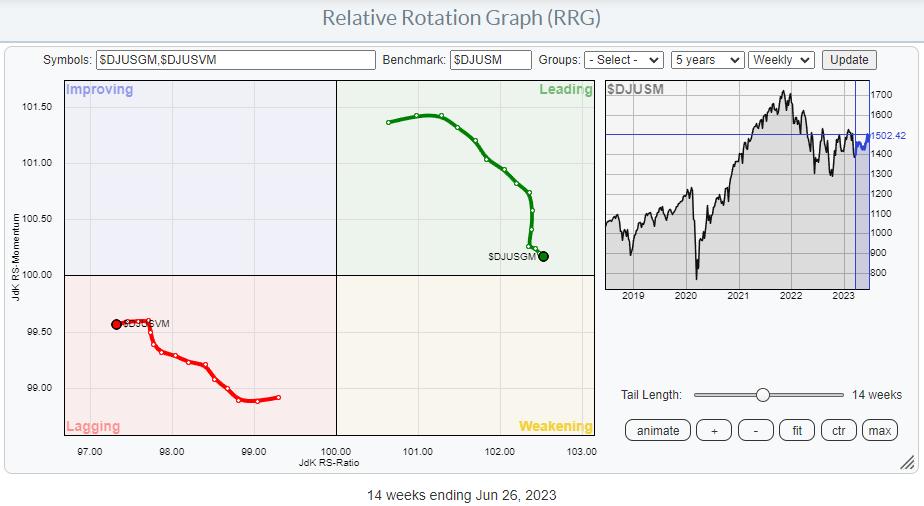
Running the same RRG for the Mid-Cap section shows a fairly similar rotational pattern. Growth is beating Value while dropping some relative momentum over the last few months.
Since the beginning of April, Growth rose 5% while Value lost 0.4%.
But a strong rotation in favor of Growth is picking up speed inside the improving quadrant on the monthly RRG.
With the growth tail on the weekly RRG starting to pick up on the RS-Ratio scale again and Value moving lower, the conclusion is similar. More upside relative potential for Mid-Cap stocks and the recent loss of relative momentum has to be seen as temporary.
Small-Cap: Growth-Value
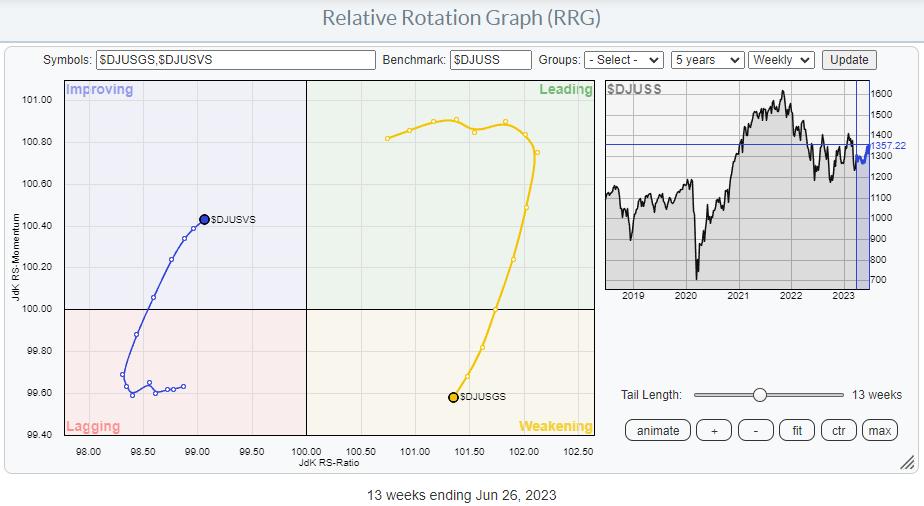
The Growth-Value rotation in the small-cap segment shows a different picture.
Growth is still on the right-hand side inside weakening, while value is on the left-hand side and improving. However, here the Growth tail has started to move lower on the RS-Ratio scale, and Value has started to move upward. This is a clear difference compared with the growth-value rotations in the Large- and Mid-cap segments.
The start of the loss of relative momentum in the small-cap segment only started at the start of May, and since then, Value has picked up 6.5% vs. 5.8 for growth.
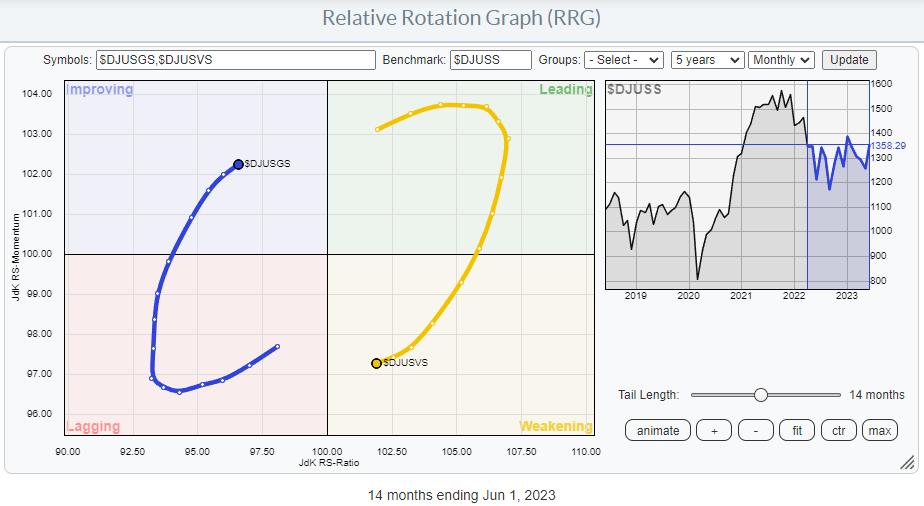
Bringing this segment to the monthly RRG shows a rotational pattern similar to the Large- and Mid-Cap segments again.
Growth: Size
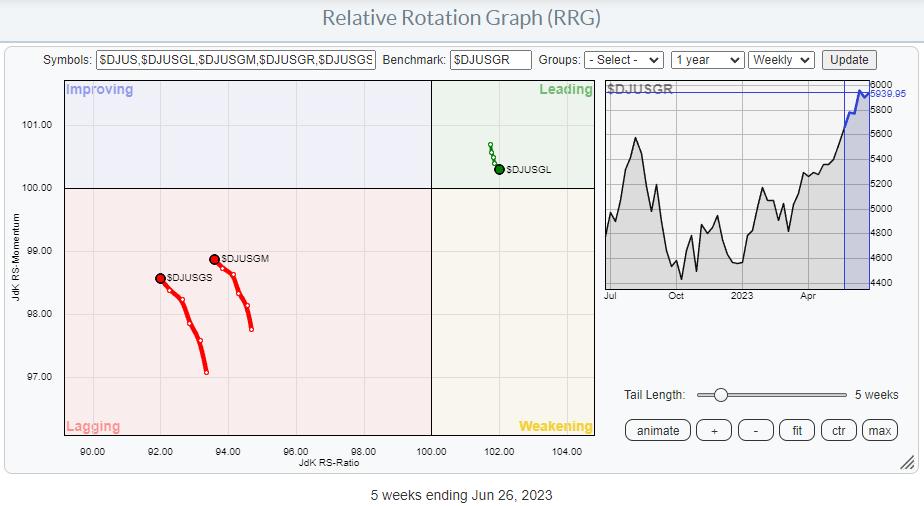
Another way to slice this universe of Value-Growth-Size indices is by plotting the size segments of the growth indices against the DJ Growth index, as seen above. Despite the recent loss (small) of relative momentum for the Large Cap Growth index inside the leading quadrant, the preference is clearly visible.
Value: Size
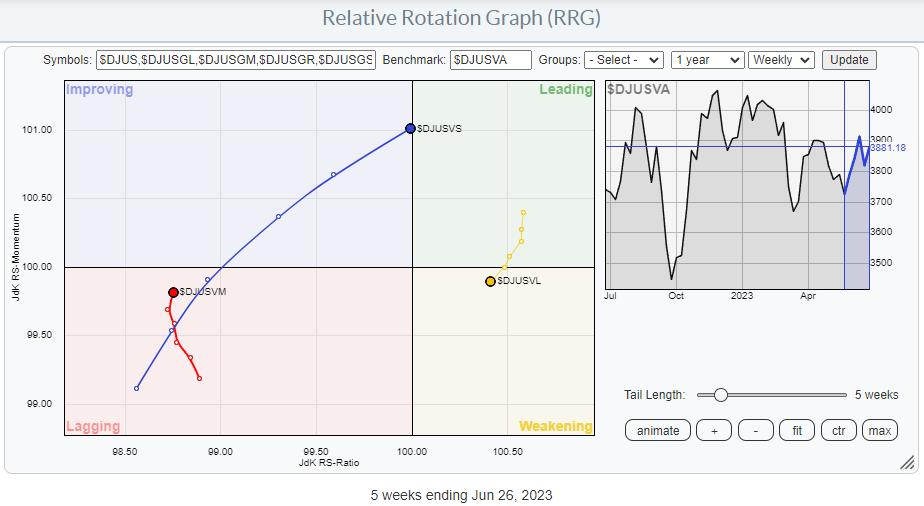
How different does the same chart look when plotting the value size segments against the DJ Value index? The strength of small-cap value stocks is remarkable, and something to keep an eye on in the coming weeks, IMHO.
Main Chart to Watch
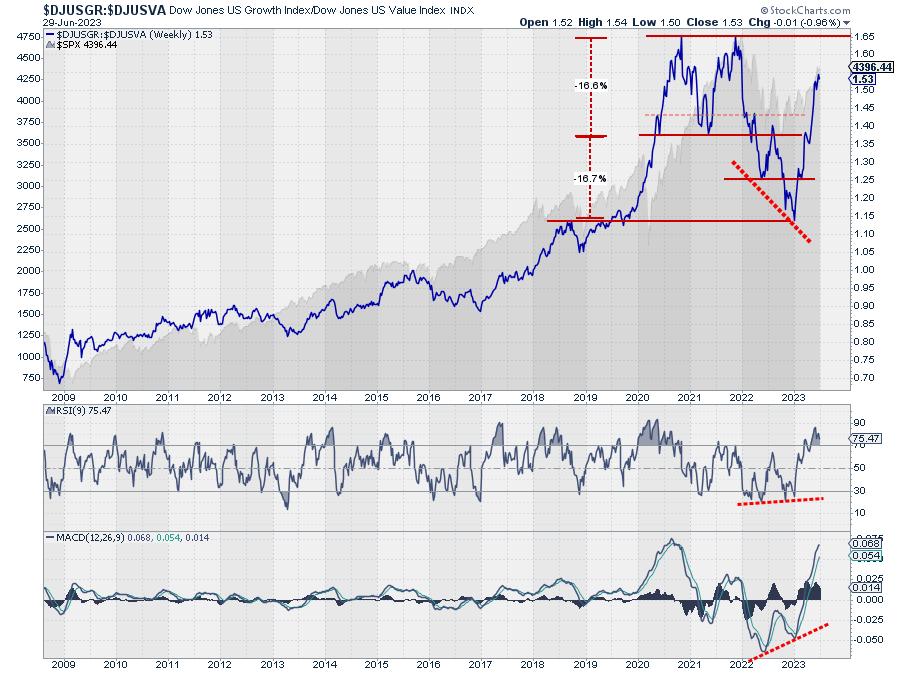
The main chart to watch is plotted above, and it shows the ratio between DJ US Growth vs DJ US Value.
After completing a massive double top and reaching its minimum target, this ratio started to rise rapidly at the start of this year. Now back above resistance offered by the 2021 low, there is room for further appreciation towards the peaks of 2020 and late 2021.
Conclusion
All-in-all, the growth-value rotation seems to be back on track in favor of growth in the coming weeks. The odd segment to watch is small-cap value stocks, which are showing remarkable relative strength compared to their Mid- and Large-Cap counterparts.
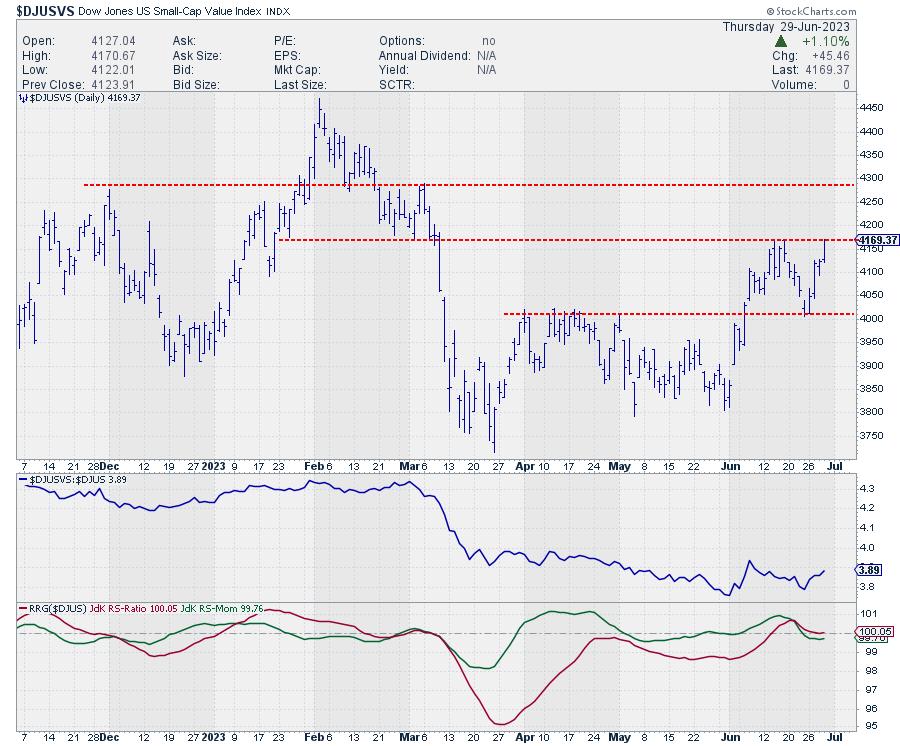
On the daily chart, this index is pushing against resistance at 4170. Once that gives way, the next level to watch will be near 4290.
#StayAlert, --Julius
Julius de Kempenaer
Senior Technical Analyst, StockCharts.com
Creator, Relative Rotation Graphs
Founder, RRG Research
Host of: Sector Spotlight
Please find my handles for social media channels under the Bio below.
Feedback, comments or questions are welcome at Juliusdk@stockcharts.com. I cannot promise to respond to each and every message, but I will certainly read them and, where reasonably possible, use the feedback and comments or answer questions.
To discuss RRG with me on S.C.A.N., tag me using the handle Julius_RRG.
RRG, Relative Rotation Graphs, JdK RS-Ratio, and JdK RS-Momentum are registered trademarks of RRG Research.


