TAKEAWAYS
- High BETA vs Low Vol Comparison as an alternative Risk ON/OFF metric
- SPHB:SPLV showing strength for High BETA stocks in all three time frames (M,W,D)
- Preference for High BETA confirms current sector rotation out of defensive sectors
In this week's episode of Sector Spotlight, I discussed the rotation out of defensive sectors into more offensive sectors. The ongoing rotation, I should say, as it is a process that has been underway for a while already.
This rotation is sending a pretty clear risk-on message.
Keep on Checking
However, it is always good to double-check any assessment and see if we can find confirmations or reasons why the assumption might be in danger.
One of the ratios that can serve in such a capacity is the relationship between high beta and low volatility stocks. Invesco's High Beta (SPHB) and Low Vol (SPLV) ETFs are perfectly suitable to monitor that relationship.
The Relative Rotation Graph below shows the rotation of these two ETFs, using SPY as the benchmark.
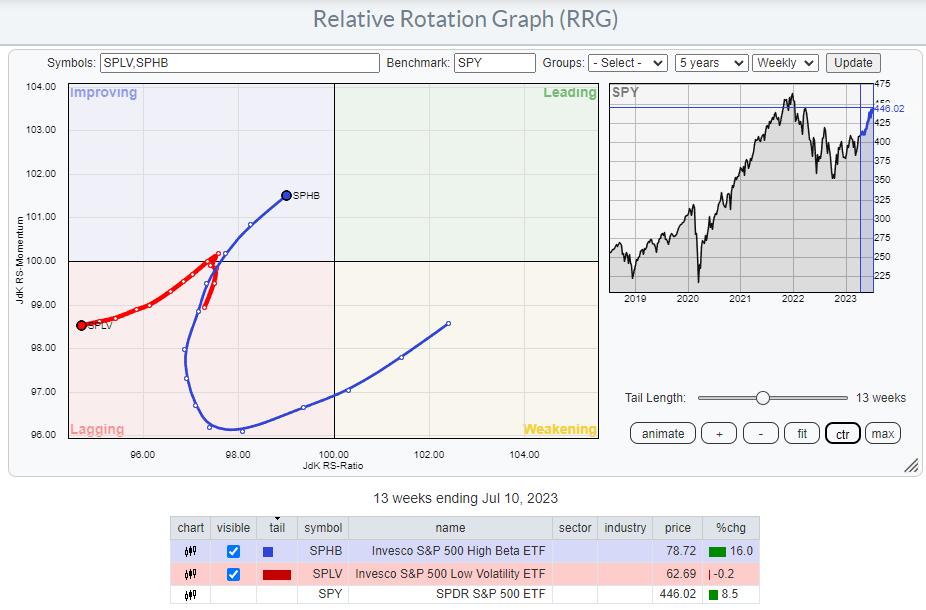
It is interesting to see how both tails are on the left-hand side of the graph. A few facts cause this:
- Both ETFs cover only 100 stocks each, while SPY holds all 500 names in the S&P 500 index. As a result, this RRG shows a so-called limited open universe.
- SPHB and SPLV are equal-weight ETFs. At their rebalancing dates, SPHB selects the 100 stocks inside the S&P 500 index with the highest BETA values over the last 12 months. SPLV selects the 100 stocks inside the S&P 500 index with the lowest-realized Volatility over the last 12 months.
We can see the impact of the comparison with the cap-weighted SPY.
A better way to show this relationship on a Relative Rotation Graph, therefore, is to use RSP, the equal-weight S&P 500 index, as the benchmark.
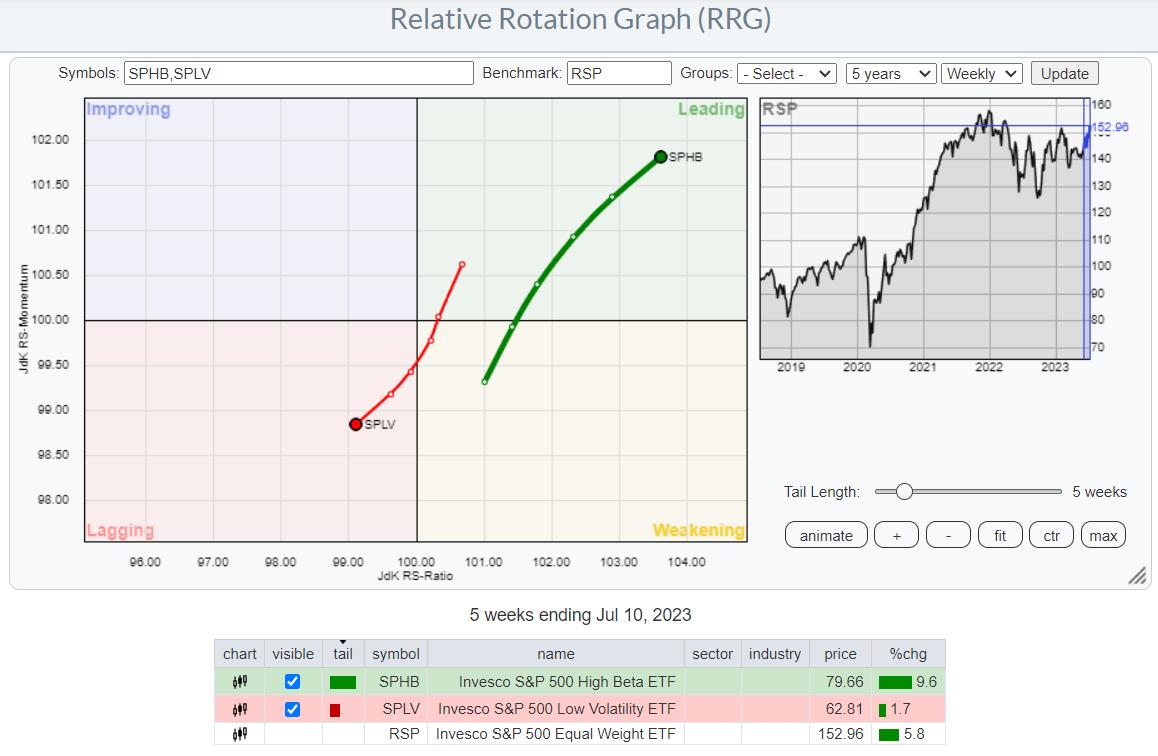
This visualization paints a much clearer picture of the strength of High Beta over Low Vol, and the rotation confirms the Risk-ON conclusion based on the current sector rotation.
Daily
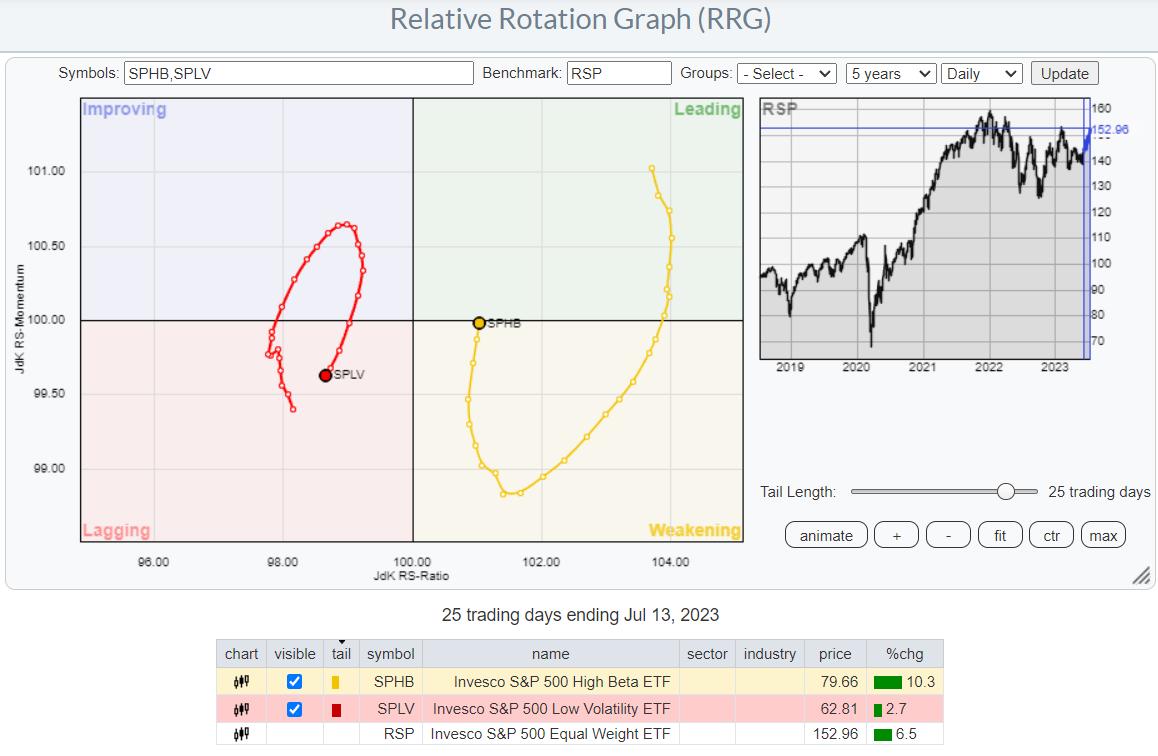
The daily RRG for this combination of ETFs fully confirms the strength of High Beta over Low Vol. The tails are completing a rotation on the same side of the graph, signaling that a strong relative up-/downtrend is underway. With SPHB just about to re-enter the leading quadrant and SPLV returning into lagging, after a short rotation through improving, a new leg higher in the rotation seems to be starting.
Monthly
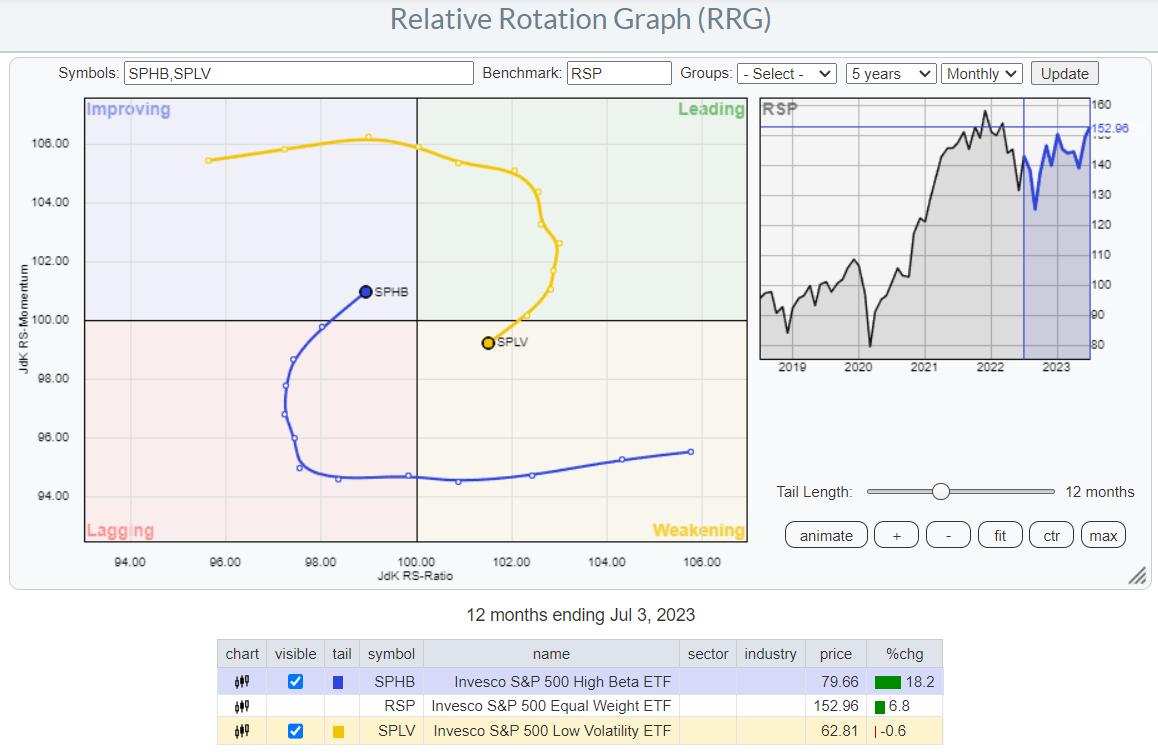
The third and final confirmation comes from the same relationship on a monthly RRG. Here we see a big rotation that has been in favor of Low Vol for quite some time, but the tails have recently rotated into RRG-Headings that favor SPHB.
With the tail for SPHB inside the improving quadrant at a strong RRG-Heading, and SPLV moving into weakening at a negative heading, the tide also seems to be turning on the longer monthly time frame. In essence, it looks like things are just starting here.
Price is the Bottom Line
As always, price is the bottom line in any potential trade.
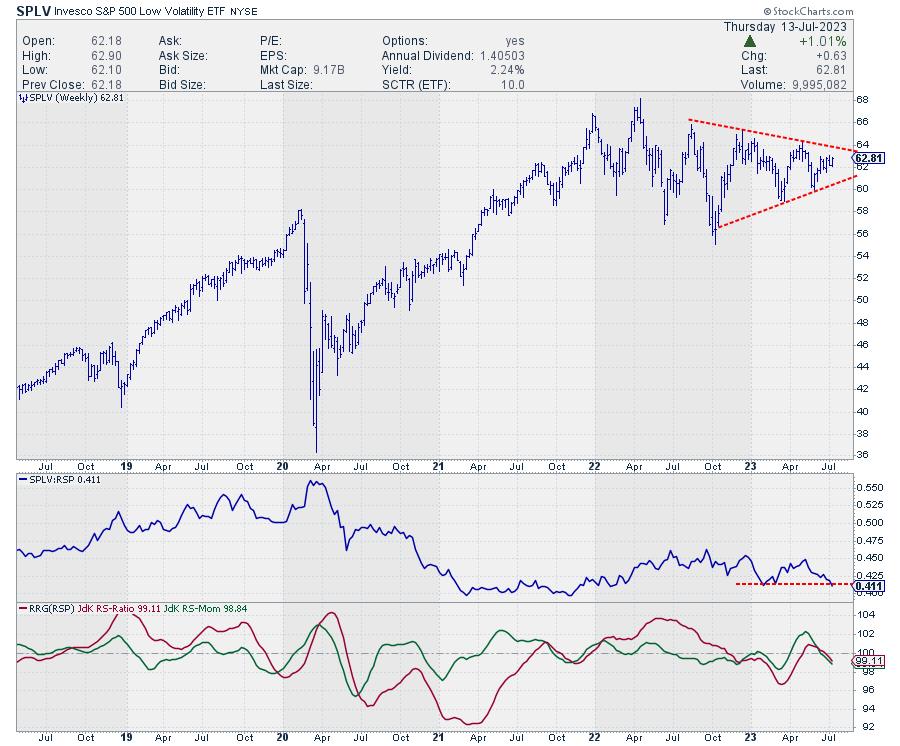
The chart of SPLV shows how it is trading in a sideways pattern that is moving into a triangle consolidation. With the general market moving higher, that is resulting in a falling relative strength line, which in its turn, is causing the RRG-Lines to sink below 100 and push SPLV into the lagging quadrant. This is on the weekly time frame.
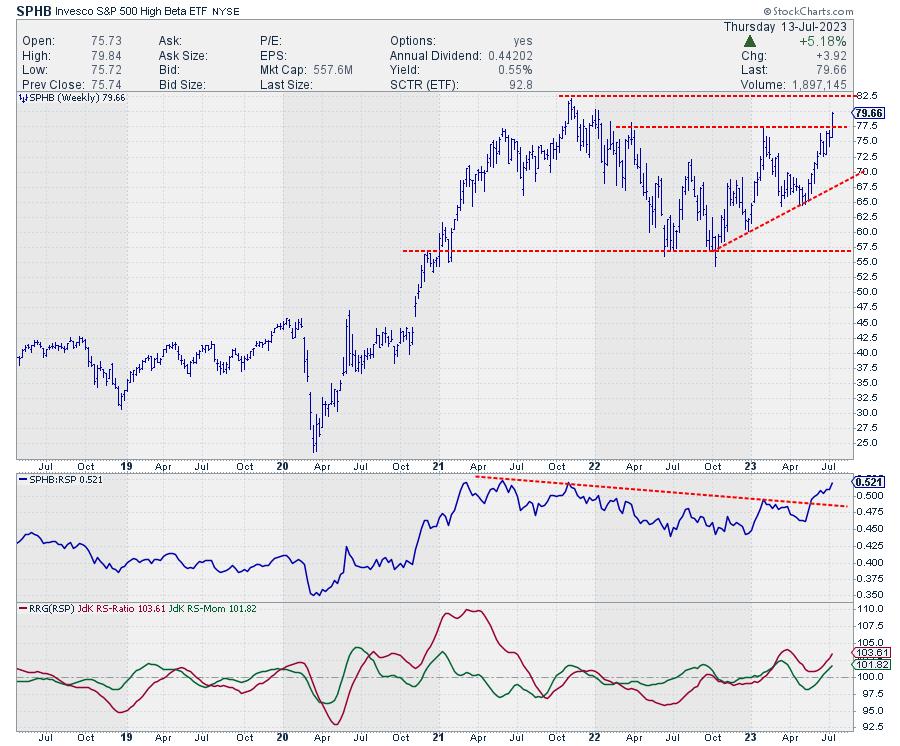
The chart for SPHB looks significantly different. It is breaking above its previous high THIS WEEK, so the break is very fresh.
The raw RS-Line recently broke above a down-sloping resistance line that ran over the highs since early 2021, and the JdK RS-Ratio line bottomed out above 100 and is now on the rise again.
Conclusion
All in all, the RRG on three different time frames, in combination with the price charts and their relatives, is underscoring the risk-ON perception fed by the current sector rotation.
#StayAlert --Julius
Julius de Kempenaer
Senior Technical Analyst, StockCharts.com
Creator, Relative Rotation Graphs
Founder, RRG Research
Host of: Sector Spotlight
Please find my handles for social media channels under the Bio below.
Feedback, comments or questions are welcome at Juliusdk@stockcharts.com. I cannot promise to respond to each and every message, but I will certainly read them and, where reasonably possible, use the feedback and comments or answer questions.
To discuss RRG with me on S.C.A.N., tag me using the handle Julius_RRG.
RRG, Relative Rotation Graphs, JdK RS-Ratio, and JdK RS-Momentum are registered trademarks of RRG Research.


