TAKEAWAYS
- US stocks are lagging the world on RRG
- The Indonesian stock market looks ready to jump
- The iShares EIDO (MSCI Indonesia) ETF can be used to play that market
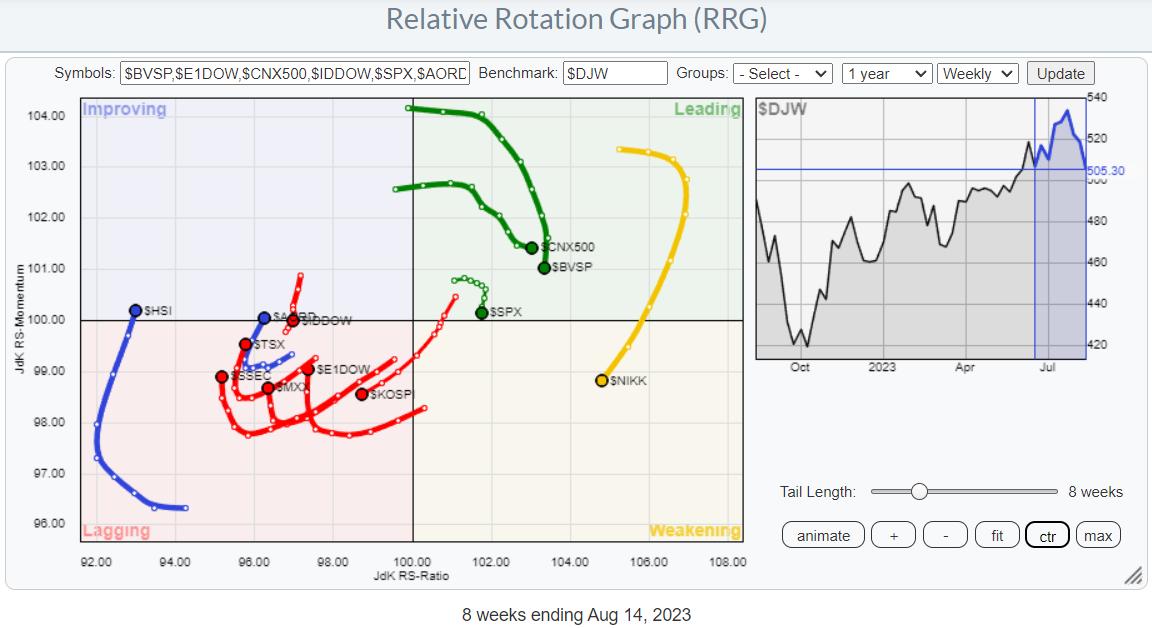
Let's take a look at the rotation of stock markets around the world. The Relative Rotation Graph above shows the rotational patterns for some major stock market indices worldwide. An interesting thing we see here is that there is a high concentration of tails inside the leading and the lagging quadrant, while there are only a handful inside improving and weakening.
Shift in Leadership
This type of rotation is typical for a shift in leadership. The strong moves in India, Brazil, Japan, and the US have now rolled over, and all four markets are showing a tail that is moving lower on the JdK RS-Momentum axis. Not so much (yet) on the JdK RS-Ratio axis.
The lagging quadrant is a bit cluttered, but when we isolate the tails (you can do that by selecting the symbol in the table below the RRG chart), you can see that only the Korean $KOSPI index is continuing further into the lagging quadrant at a negative RRG-Heading. All others have curled upward, or are in the process of doing so, and are subsequently heading towards improving.
Hong Kong ($HSI), Australia ($AORD), and Indonesia ($IDDOW) have just crossed over into the improving quadrant. Indonesia shows the more interesting rotation, as its tail has rapidly rotated back from a negative RRG-heading into a positive one. Out of the indices on the right-hand side, it's obviously the S&P 500 we want to keep an eye on.
Probably a Temporary Setback in the S&P
On the RRG, the tail for the S&P 500 is still inside the leading quadrant, but is rolling over and close to crossing into weakening.
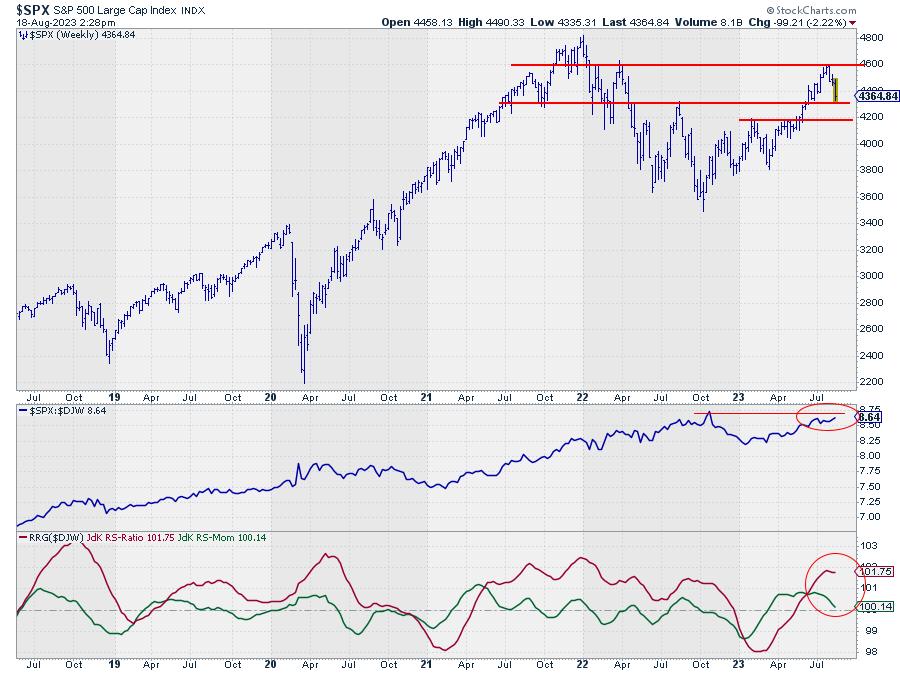
The chart above shows the S&P on a weekly scale, in combination with raw Relative Strength and the RRG-Lines. So far, the technical support and resistance levels are respected quite well. After breaking 4.325 in an upward direction, $SPX rallied to the level of the March 22 peak near 4.600, where a new high was put into place, indicating that supply got the upper hand in that area.
At the moment, the market is back to the breakout level and starting to test the area around 4.325 as support. The overhead pressure has caused relative strength to lose momentum and flatten out a bit over the last few weeks, which is causing the RRG-Lines to roll over. With the RS-Ratio still at fairly high levels, this tail still has the room to complete a rotation leading-weakening-leading.
In an ideal scenario, the market should now find support near 4.325 and start building a new base (higher low), out of which a new rally can start for a new attempt to move past 4.600. Without damaging the current trend, it would even be possible for $SPX to move back to the 4.200 area and find support there. Below 4.200, the current trend will get into serious trouble.
From a relative perspective, a break of relative strength above the late 2023 high will put the US back on the international map as one of the leading markets. This will need to happen in the next few weeks, say 4-6, in order for the RS-Ratio line to put in a new low above 100 and cause that leading-weakening-leading rotation.
Indonesia Ready to Rally?
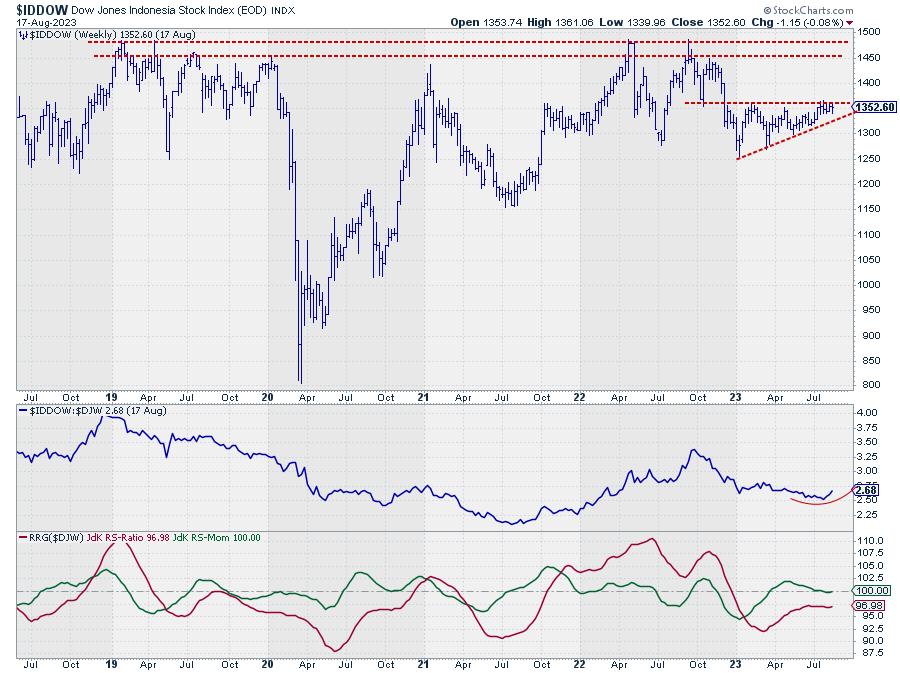
The tail on the DJ Indonesia index on the left-hand side of the graph shows a rapid rotation back into a positive RRG-Heading and a push into the leading quadrant. This suggests that more improvement is underway. The big question is whether this will also only be a temporary move or be more sustainable.
Looking at the price graph above shows that the Indonesian market has been trading in an ascending triangle formation since the start of the year, with the horizontal (resistance) side around 1.360. As soon as that barrier gives way, new upside potential will be unlocked that could push $IDDOW up to the area between 1.450-1.500.
That area is particularly important, as it is the region where major highs have been formed since 2018. This means that, for more than five years now, massive supply has hit the market between 1.450-1.500. Imagine what could happen when the market has fully absorbed that supply...
I always compare these setups with a spring that has been put under pressure for a long time. A lot of energy is then contained, and when that spring gets let loose, it will unleash a lot of power. In other words, once $IDDOW is able to clear the 1.450-1.500 range, a lot of upside potential will get unlocked. Definitely a market to watch.
US investors can use the iShares MSCI Indonesia ETF (EIDO) to get exposure to the Indonesian market.
#StayAlert and have a great weekend, --Julius
Julius de Kempenaer
Senior Technical Analyst, StockCharts.com
Creator, Relative Rotation Graphs
Founder, RRG Research
Host of: Sector Spotlight
Please find my handles for social media channels under the Bio below.
Feedback, comments or questions are welcome at Juliusdk@stockcharts.com. I cannot promise to respond to each and every message, but I will certainly read them and, where reasonably possible, use the feedback and comments or answer questions.
To discuss RRG with me on S.C.A.N., tag me using the handle Julius_RRG.
RRG, Relative Rotation Graphs, JdK RS-Ratio, and JdK RS-Momentum are registered trademarks of RRG Research.


