TAKEAWAYS
- $INDU chart resting at double support and likely to bounce higher
- Outperform the index by avoiding four stocks
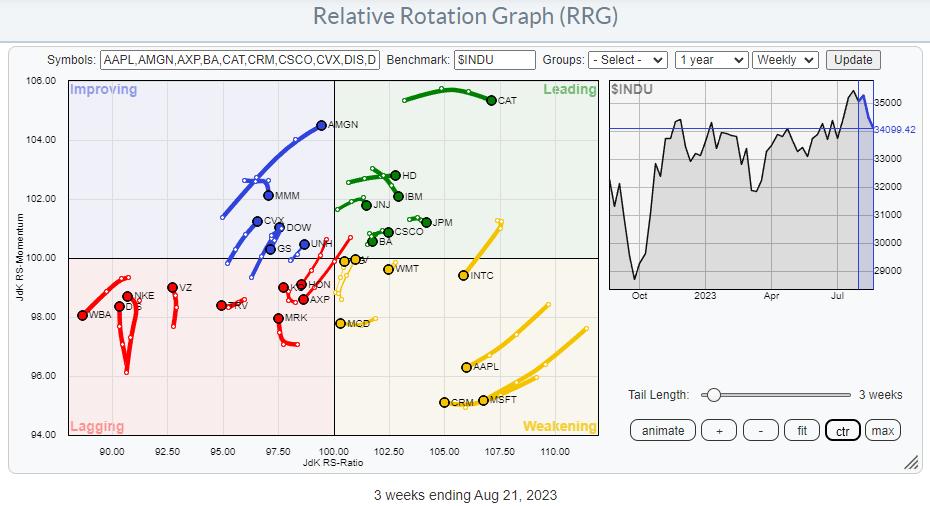
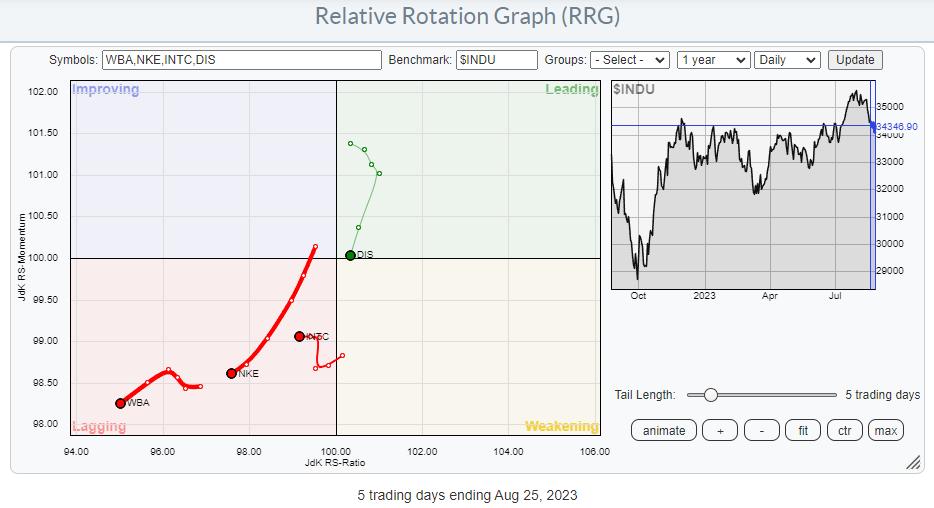
The Relative Rotation Graph above, which shows the rotations inside the DJ Industrials index, exhibits an evenly-spread-out universe of stocks. This is primarily the result of $INDU being a price-weighted index, as opposed to the S&P 500, which is cap-weighted. The difference in weight between the largest and the smallest stock in the universe is, therefore, much smaller, which makes the RRG more evenly distributed.
DJ Industrials
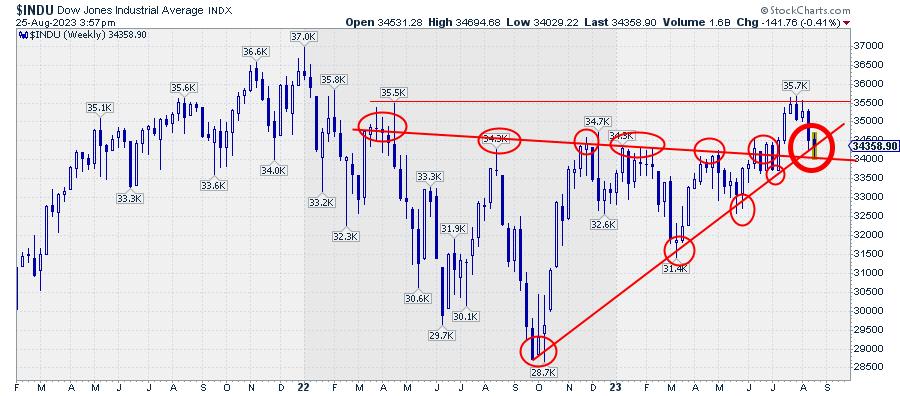
The price chart of the DJ Industrials index shows the market at a crucial level/juncture.
First, the slightly down-sloping former resistance level runs over the major highs since early 2022. That line was broken upward in June/July, and the market is testing that level as support as we speak. Secondly, the angled support line connects the lows since October 2022. That line is currently being tested for the fifth time.
The amount of touchpoints on these trend lines makes them very valid market levels to be watched, IMHO.
A quick assessment of this price chart tells me that:
- The DJ Industrials index is still in a rhythm of higher highs and higher lows, which started out of the low in March.
- The former resistance line running over the highs since March 2022 is currently being tested as support.
- The rising support line out of the October 2022 lows is currently being tested.
- As described above, both support levels are now coming together around 34k, making that area an important "double" support level/area.
All in all, this means that a new low being put into place in this area should be seen as a buying opportunity for another leg up within the existing uptrend. Especially with double support so close, these sort of setups provide good risk/reward ratios.
The first hurdle and target that comes in sight on the upside is the horizontal level at 35.5-35.7.
Back to the RRG
The RRG above can greatly help select stocks within the DJ Industrials index that are likely to help push the index higher. BUT, for this occasion, I want to look at which stocks better be avoided.
The first thing I do in a first pass is to toggle through the index members by highlighting the line in the table below the graph, either by clicking with the mouse or using the up-and-down arrow keys to browse the universe. The resulting tails are plotted on the RRG below. Remember, I am looking for stocks likely to UNDERperform the index.
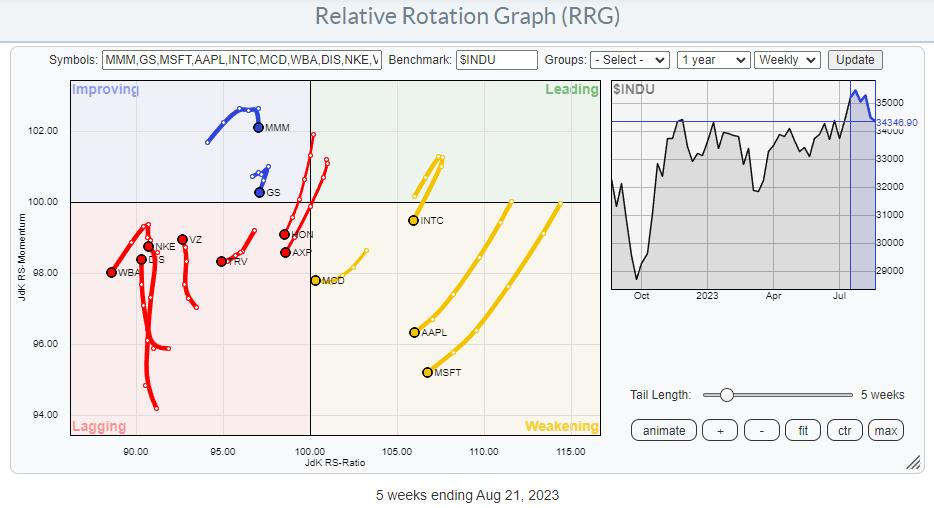
These are the weekly tails. But to really get to the point and find actionable securities (to avoid), I bring this group to a daily RRG.
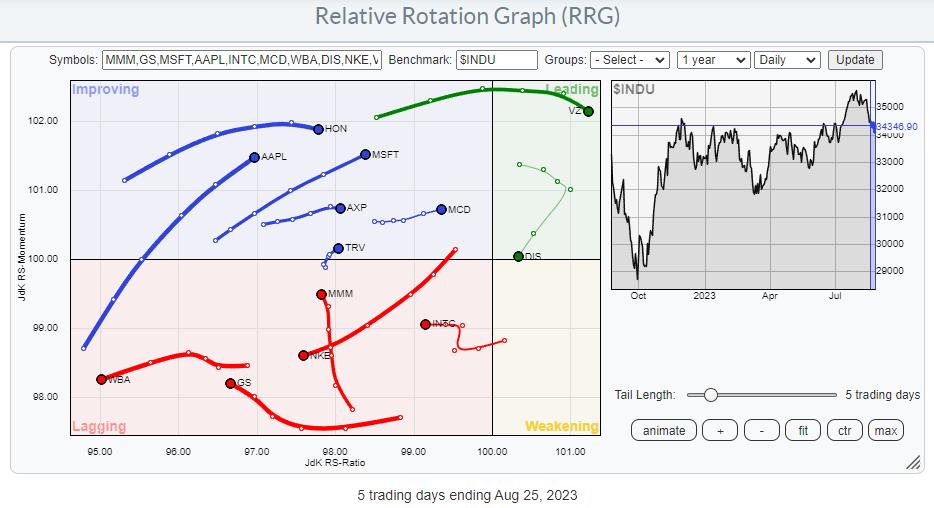
On this RRG, I do another pass to find the stocks on a negative trajectory on both the weekly and the daily timeframes.
Here is the result.
As always, the proof is in the price.
DIS
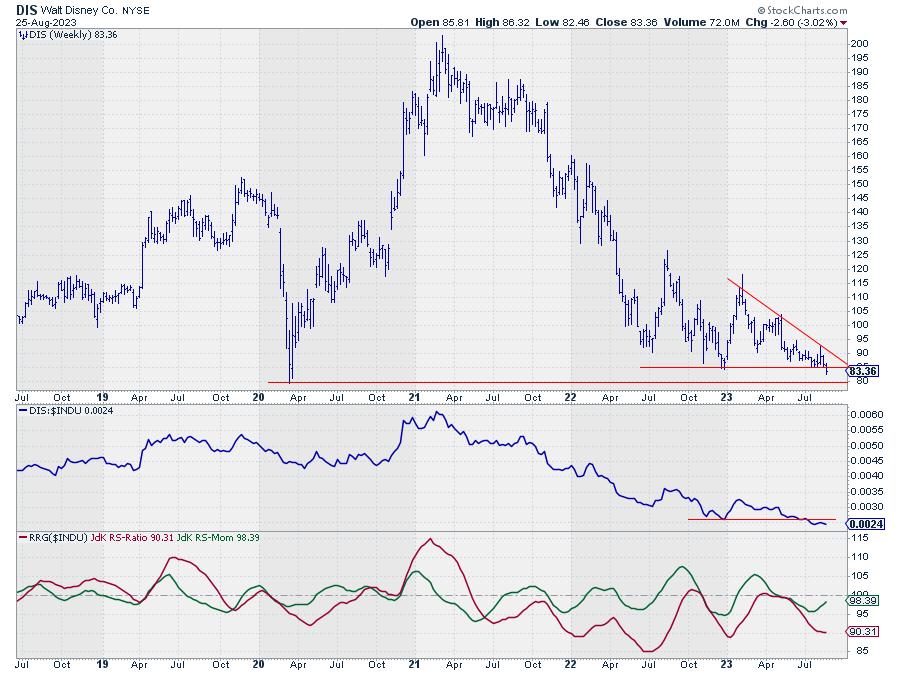
This week, DIS is sinking through important horizontal support near 85. There is one more important support level left, around 80. This was a low in March 2020 and in Feb 2016.
The break below 85 is already pretty negative, but when 80 also gives way, there will be a new scary roller coaster ride in Disneyland.
INTC
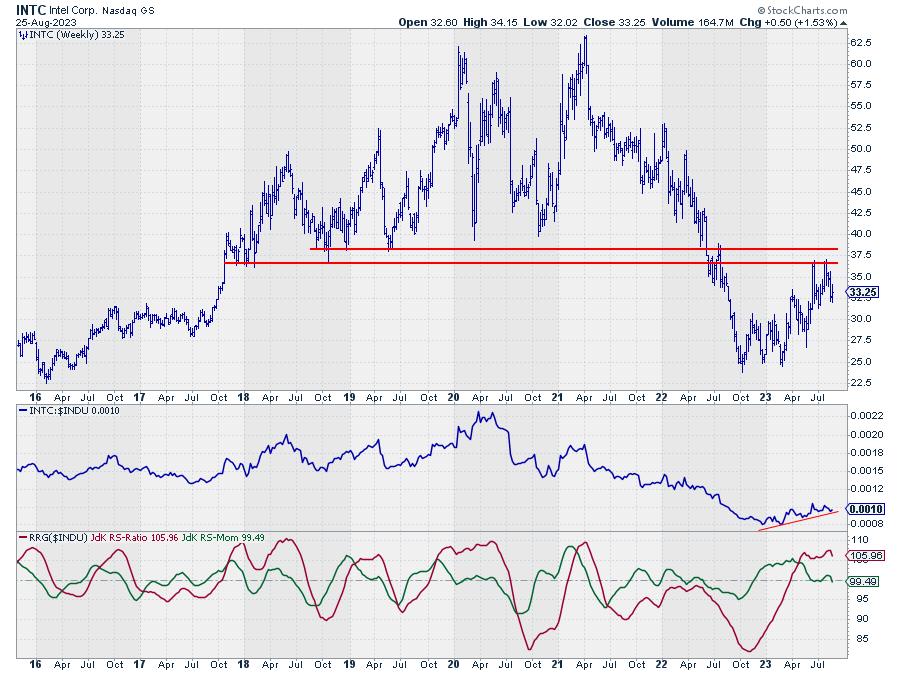
INTC rotated from leading into weakening on the weekly RRG, and the daily tail just crossed into lagging and continued to move lower on the RS-Ratio scale after a short momentum hiccup.
On the price chart, INTC recovered from its steep decline after breaking horizontal support in June. However, the rally that emerged from the October and Feb lows at 25 has tested old support near 37 as resistance twice and failed to break higher.
Breaking the most recent low near 27 will complete a double top formed against major overhead resistance, while relative strength is fading (RRG lines are rolling over). This will likely trigger more downside and a test of the area near 25 again.
NKE
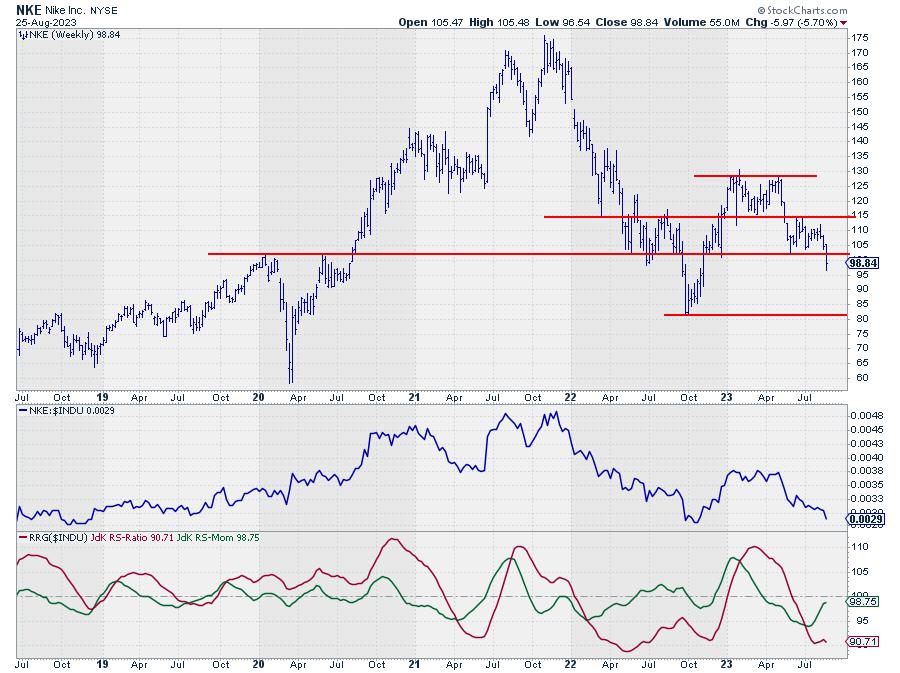
This week, NKE is breaking below another major support level near 102. This happened after NKE had already completed a double top at 129 by breaking the in-between low at 115.
This week's break lower also marks the break from a small consolidation/continuation formation, which adds to the evidence for more weakness ahead. With no intermediate support in sight, the next meaningful level, and therefore the first target for NKE, is only found at the October 2022 low, just above 80.
That means roughly 20% downside risk, with only 3% upside potential (back to the breakout level).
WBA
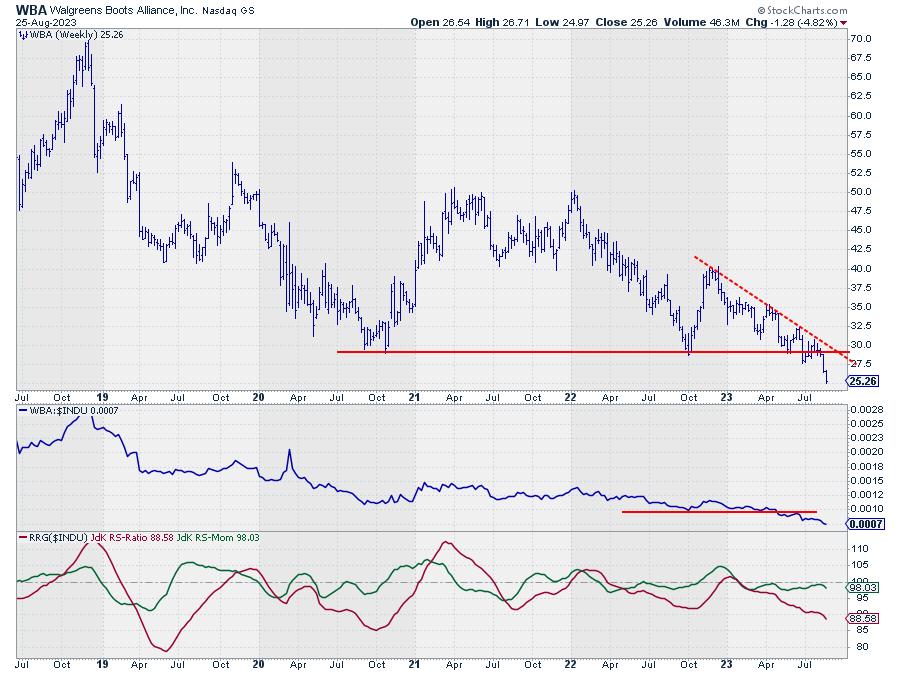
WBA is already been underperforming the DJ industrials for years. But the recent break below a major horizontal support level at 28.50 adds new fuel for the ride's lower price and relative performance. This break in price, combined with the horrible relative strength, makes WBA the worst stock inside the DJ industrials index.
How bad the damage really is is best seen on a monthly chart.
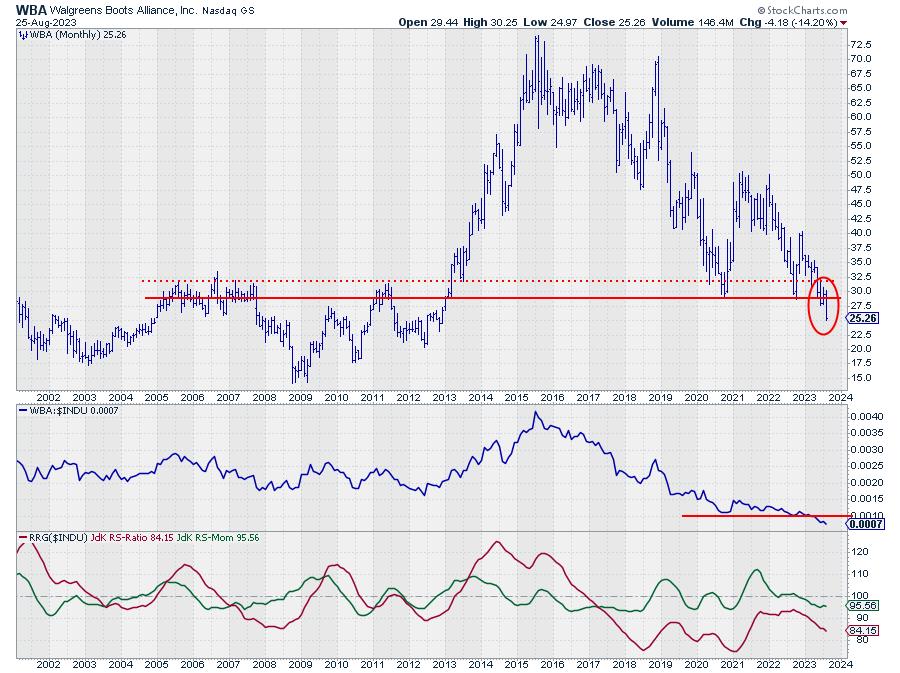
WBA is breaking to its lowest level in a decade. I don't need a calculator to know that this is one massive underperformer compared to the S&P 500 over the same period.
Conclusion
The technical outlook for the DJ Industrials index remains strong, as long as the index manages to hold above double support near 34k on the price chart.
By underweighting or avoiding DIS, INTC, NKE, and WBA, it should be possible to outperform the index with very limited risk. A potential strategy to achieve this would be to buy Diamonds (DIA) and create downside exposure via options or straight short sales for these four stocks.
#StayAlert and have a great weekend, --Julius
Julius de Kempenaer
Senior Technical Analyst, StockCharts.com
Creator, Relative Rotation Graphs
Founder, RRG Research
Host of: Sector Spotlight
Please find my handles for social media channels under the Bio below.
Feedback, comments or questions are welcome at Juliusdk@stockcharts.com. I cannot promise to respond to each and every message, but I will certainly read them and, where reasonably possible, use the feedback and comments or answer questions.
To discuss RRG with me on S.C.A.N., tag me using the handle Julius_RRG.
RRG, Relative Rotation Graphs, JdK RS-Ratio, and JdK RS-Momentum are registered trademarks of RRG Research.
