TAKEAWAYS
- Short Term, Risk-Off Sector Rotation While Heading into new week
- Did The Market Complete a H&S Top, or Is SPY Looking For Support?
- 430 Is The Crucial Level To Watch in SPY
First of all, my apologies for everybody who has been waiting for a Sector Spotlight this week. I traveled back from the US on Monday, got caught up in working on back-log stuff, and now it is Friday already :(
A new SSL will be recorded and posted on Monday! Sorry for the delay.
But here's a quick take on sector movements over the past few days.
Daily Sector Rotation
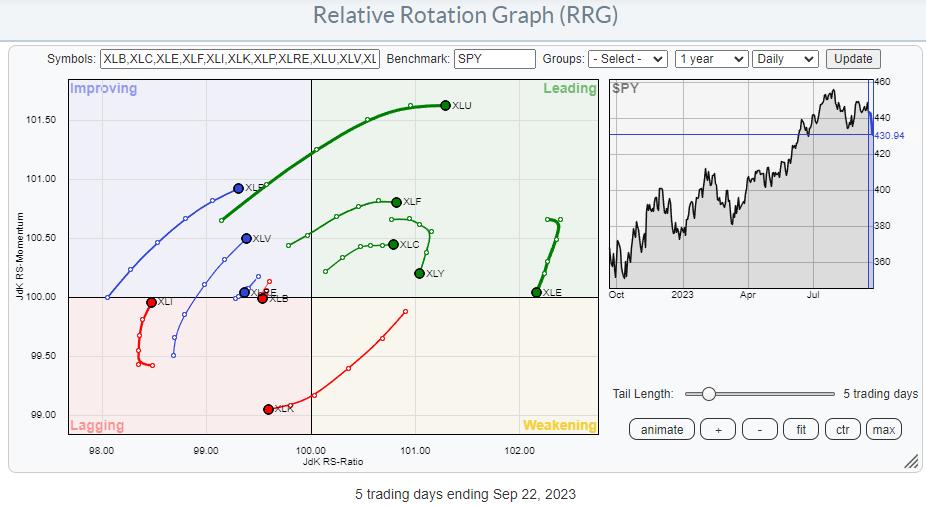
The daily RRG for this week shows an apparent risk-off rotation with XLU, XLV, and XLP on strong RRG-Headings moving into or toward the leading quadrant.
On the opposite side, it is primarily XLK moving into the lagging quadrant while XLY and XLE are still inside, leading but rolling over and losing relative momentum.
With the S&P 500 down almost three percent, it is a bad week for the markets.
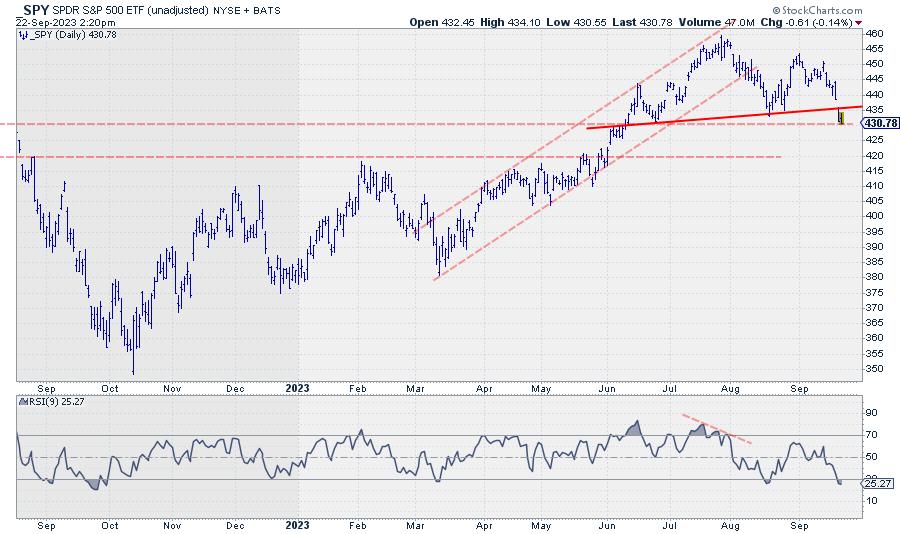
Looking at the daily chart of SPY, I see two possible scenarios.
Completed Head & Shoulders Top, or Market Finding Support?
The first is a completed H&S (like) formation triggered yesterday when the neckline broke with a downward gap. Measuring the top of the formation to the neckline and projecting that distance downward from the breaking level puts the target for the pattern around 405-410 in SPY.
Upside potential will be limited to the level of the neckline. Former support returning as resistance and/or the gap area between 435 and 440.
The second scenario could be that SPY is currently trying to find support at the level of the August 2022 high, and possibly starting to form a new low against that support level.
I am leaning more toward the second scenario, where SPY is trying to find support and possibly looking for renewed upside movement from current levels. This is primarily based on the sector rotation as it is still playing out on the weekly RRG.
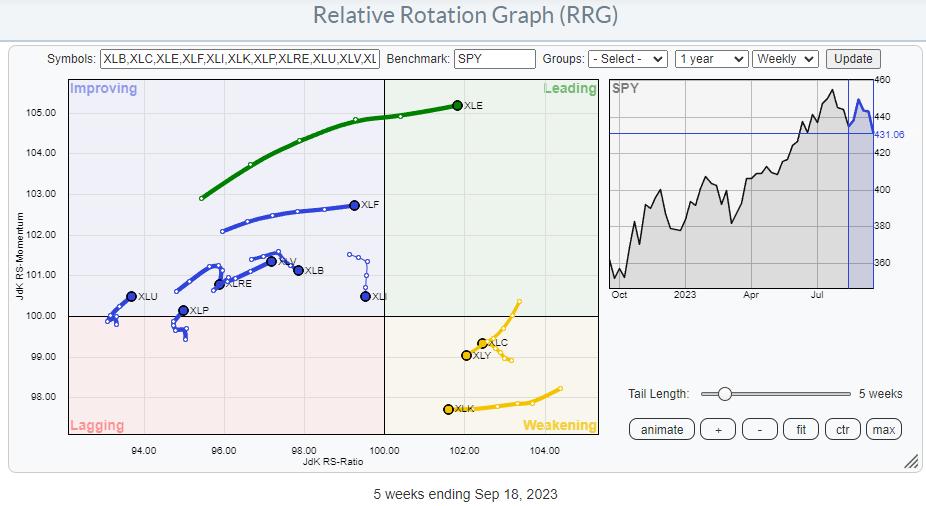
XLC, XLY, and XLK are still inside the weakening quadrant and leveling off in terms of relative momentum, potentially setting the tails up for a rotation back up towards leading and resuming their relative uptrends against SPY.
The defensive sectors, XLP, XLV, and XLU, are all inside the improving quadrant, showing short tails and potentially rolling over to start moving lower, back towards the lagging quadrant.
430 Holds The Key
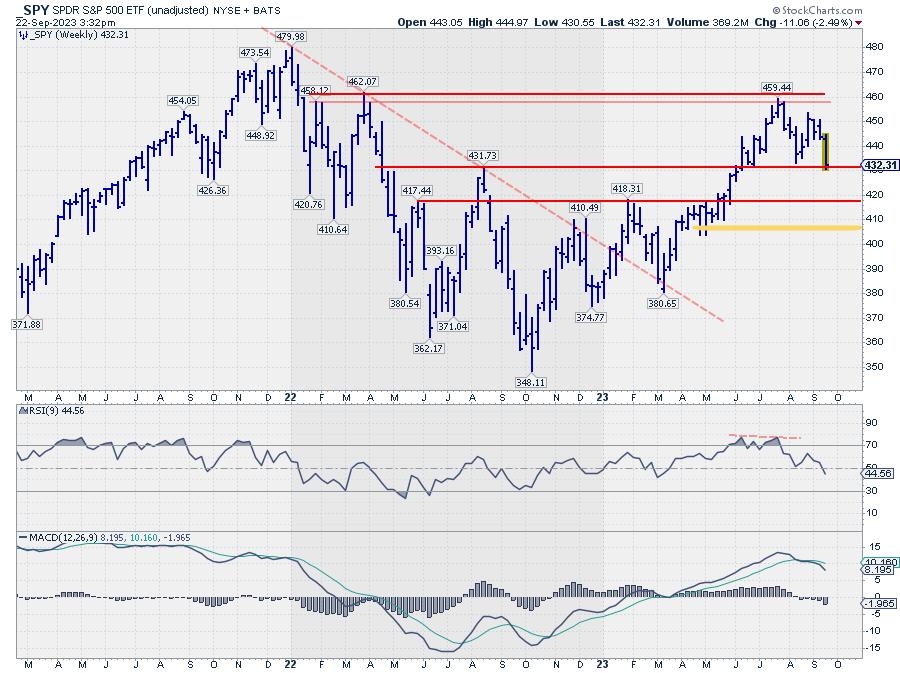
In either case, the area around 430 is crucial for the development in SPY in the coming week(s). If it holds, the market can get more constructive again and seek higher levels.
A clear break lower will confirm the first (H&S) scenario and its possible target area and negate the second scenario simultaneously. From a sector rotation perspective, the moves that I will be watching next week are:
When the daily tails for XLY, XLV, and XLP start to roll over, and XLY, XLK, and XLC pick up strength again, that would support scenario 2. This should be followed by a further rotation towards the leading quadrant on the weekly RRG for XLY, XLK, and XLC shortly after, and the defensive sectors rolling over while they are still inside the improving quadrant.
A continued strength for the group of defensive sectors in the coming week, possibly combined with SPY challenging 430, will be seen as a very strong sign of scenario one starting to play out. In the case of SPY breaking below 430, the first meaningful support level is found just below 420 in the area of the Jan 2023 peak.
#StayAlert and have a great weekend, --Julius
Julius de Kempenaer
Senior Technical Analyst, StockCharts.com
Creator, Relative Rotation Graphs
Founder, RRG Research
Host of: Sector Spotlight
Please find my handles for social media channels under the Bio below.
Feedback, comments or questions are welcome at Juliusdk@stockcharts.com. I cannot promise to respond to each and every message, but I will certainly read them and, where reasonably possible, use the feedback and comments or answer questions.
To discuss RRG with me on S.C.A.N., tag me using the handle Julius_RRG.
RRG, Relative Rotation Graphs, JdK RS-Ratio, and JdK RS-Momentum are registered trademarks of RRG Research.


