TAKEAWAYS
- Commodities and USD rotating deep inside the lagging quadrant, indicating weak relative strength
- Bitcoin is in a strong relative uptrend vs all other asset classes, but going through a corrective phase
- Stocks are the clear winner in this asset allocation battle
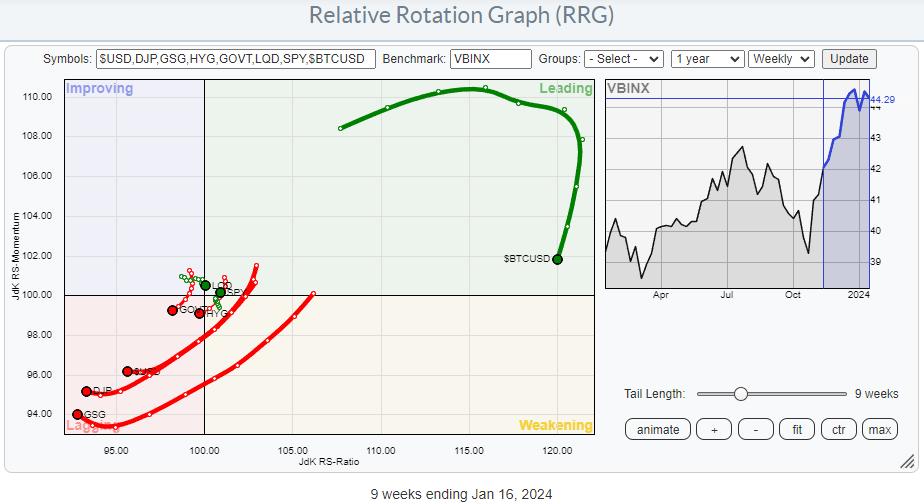
The RRG above shows the rotation of various asset classes, using VBINX (Vanguard Balanced Index Fund) as the benchmark. The long red tails pushing deep into the lagging quadrant are for Commodities (DJP&GSG) and $USD, while the long Green tail deep inside the leading quadrant and moving lower is for BTC.
The first takeaways from this RRG are:
- BTC is in a very strong relative uptrend vs. all other asset classes, but is currently going through a setback, potentially offering a "buy-the-BIT-dip" scenario in the next few weeks.
- The long red tails deep inside the lagging quadrant are for Commodities (DJP&GSG) and $USD. These asset classes are in a strong relative downtrend. The slight pickup in relative momentum (JdK RS-Momentum) is not meaningful enough (yet) to warrant any action.
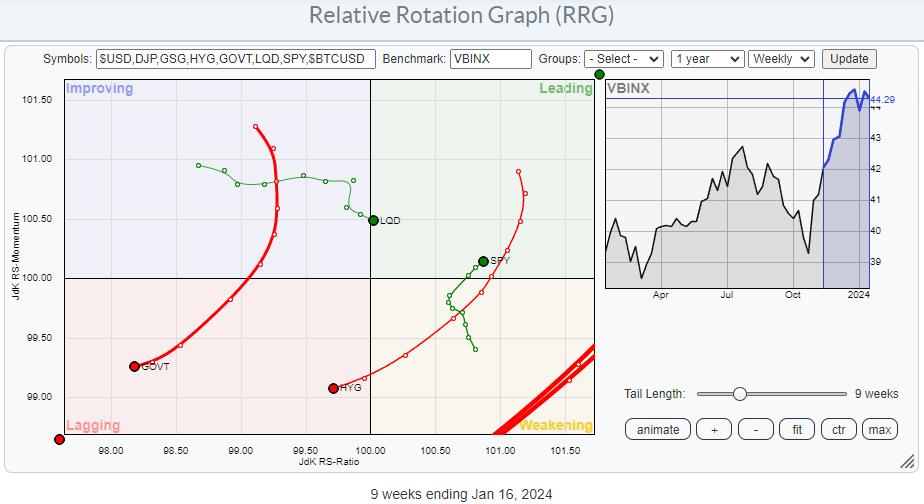
Zooming in on the center of the RRG highlights the rotations for stocks and fixed-income asset classes. It shows a strong rotation for stocks, and it has been doing that for weeks already.
The tail on SPY rotated through weakening, after a stint through leading, and is now moving back into the leading quadrant. As you know, this is one of the strongest possible rotations, as it signals the start of a new up-leg within an already rising relative trend.
The fixed-income tails are moving in the opposite direction, except for corporate bonds.
- Government Bonds (GOVT) rotated back into the lagging quadrant from improving and is now back at a negative RRG-Heading, moving further into the lagging quadrant.
- High-yield bonds (HYG) have just crossed back into the lagging quadrant after a full rotation through leading and weakening, starting a new relative downtrend.
- Corporate Bonds is currently the strongest asset class in the fixed-income domain, crossing into leading but doing so at a negative RRG-Heading.
All in all, these rotations present a very clear picture in favor of stocks over bonds.
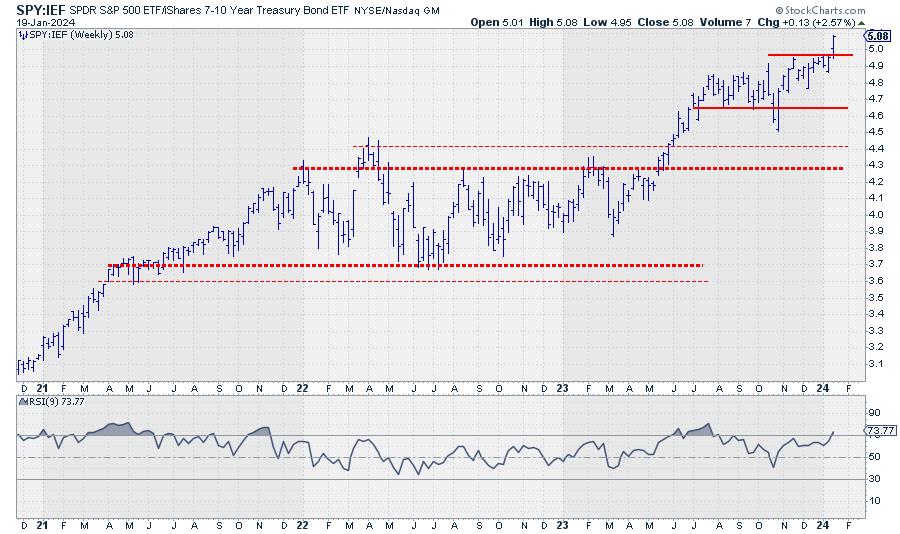
The direct comparison of SPY against IEF underscores this strength with a solid breakaway from the consolidation period in play since Q4-2023. The break to new highs unlocks fresh upside potential for more outperformance of stocks.
#StayAlert, --Julius
Julius de Kempenaer
Senior Technical Analyst, StockCharts.com
Creator, Relative Rotation Graphs
Founder, RRG Research
Host of: Sector Spotlight
Please find my handles for social media channels under the Bio below.
Feedback, comments or questions are welcome at Juliusdk@stockcharts.com. I cannot promise to respond to each and every message, but I will certainly read them and, where reasonably possible, use the feedback and comments or answer questions.
To discuss RRG with me on S.C.A.N., tag me using the handle Julius_RRG.
RRG, Relative Rotation Graphs, JdK RS-Ratio, and JdK RS-Momentum are registered trademarks of RRG Research.


