TAKEAWAYS
- NYFANG+ Index at elevated levels in strong uptrend.
- New long positions are exposed to high risk.
- I found a pair trading opportunity within the NYFANG universe to avoid directional market risk.
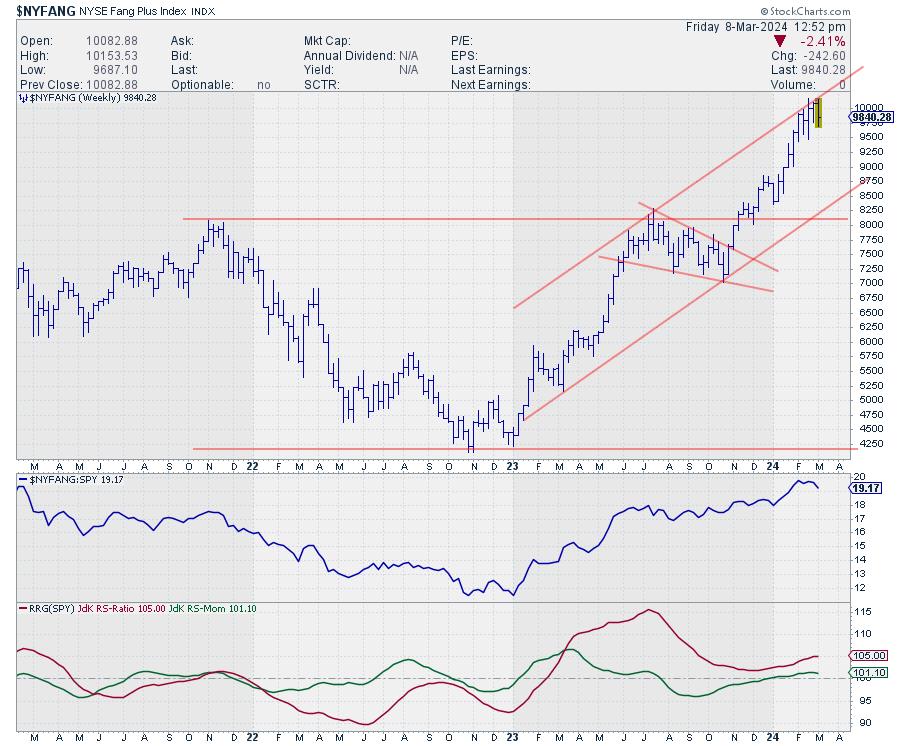
It is no secret that the NYFANG+ Index is still in in incredible up-run after bottoming out in October last year and subsequently breaking significant overhead resistance around 8.000. In the last 3-5 weeks, the index stalled just below 10.000 and moved sideways.
Split Universe
However, under the hood, some big moves are taking place. These are clearly visible on the Relative Rotation Graph.
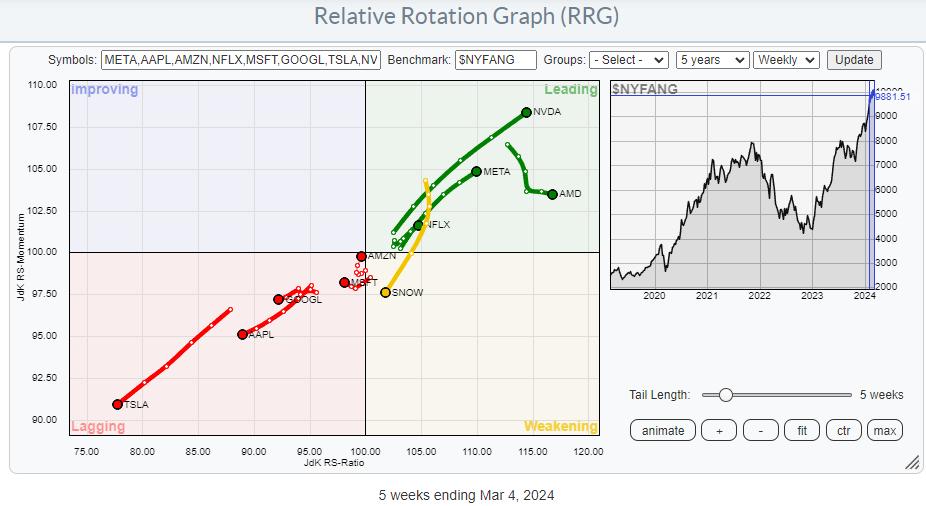
On the weekly RRG, the split between the individual stocks in this universe is clearly visible. AMD, NVDA, META, and NFLX are all inside the leading quadrant AND in a positive RRG-Heading. AMZN is inside the lagging quadrant but very close to the benchmark and on a positive RRG-Heading. TSLA, AAPL, GOOGL, and MSFT are inside lagging AND on a negative RRG-Heading. Also on a negative RRG-Heading, but inside the weakening quadrant, is SNOW. MSFT is the only stock inside lagging, not on a negative or a positive heading.
Given the incredibly steep rise of the market (NYFANG), entering new long positions at current levels means taking a lot of risk. In no way does this mean selling when you hold the index or the stronger stocks in this group. The trend is undeniably still up. But as we all know, the longer and the steeper a trend gets, the higher the risk is getting.
Still, looking for some trading action, I would prefer looking at some pair trading opportunities.
The Long Side
The candidates for the long side of a pair trade would be NVDA, META, AMD, NFLX, and AMZN.
Looking at the individual charts of NVDA, META, and AMD, they are on almost vertical trajectories and very deep inside the leading quadrant. This leaves NFLX and AMZN as potential candidates, as they seem to have some upside potential left in them.
AMZN or NFLX
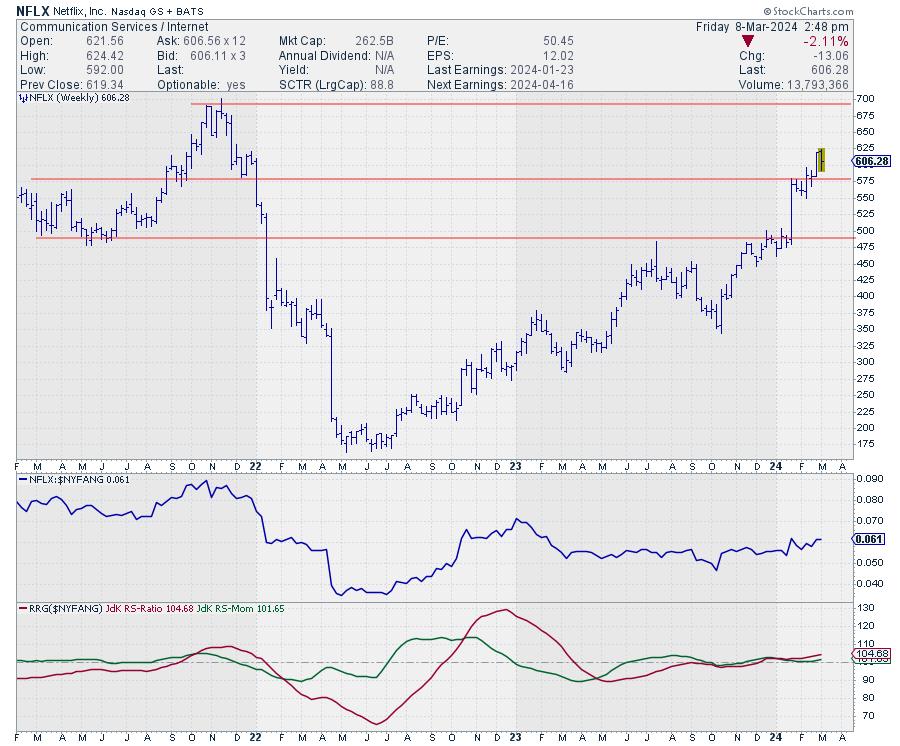
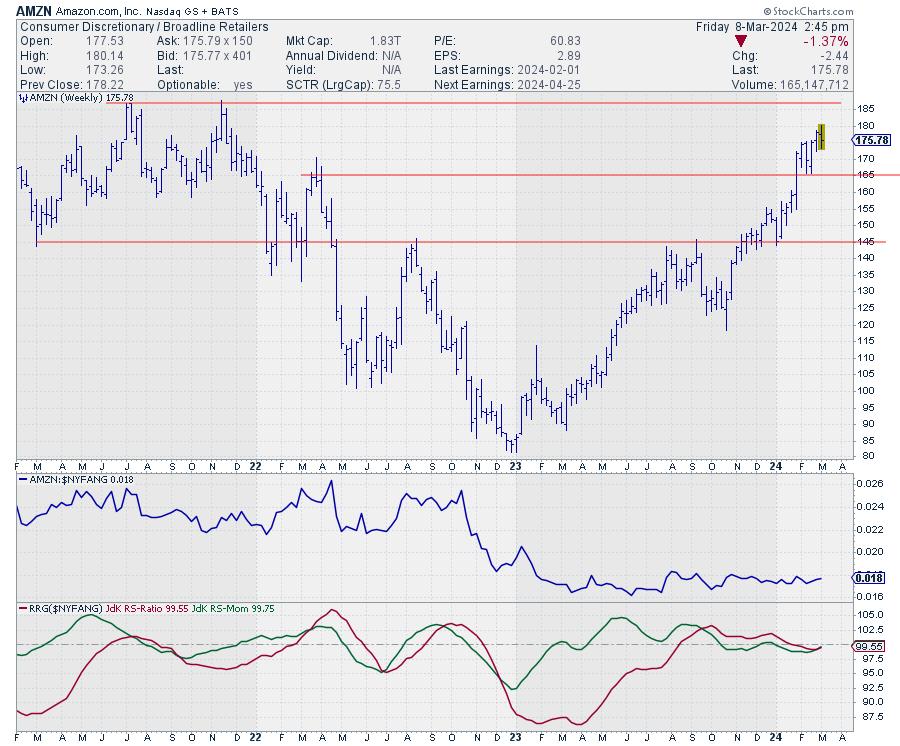
Looking at both charts, I see that they look very similar. Both have recently broken overhead resistance and both are underway to test their respective all-time high levels.
The upside potential, measured from current levels to ATH for NFLX, is around 14%, whereas, for AMZN, it is only 6%. Combine that with the tail for NFLX already being inside the leading quadrant and at a strong RRG-Heading while AMZN is still inside the lagging quadrant (on a positive heading), and my preference goes to NFLX. It has more price potential and has already made the turnaround from a relative downtrend to a relative uptrend.
The Short Side
The candidates for the short side of a pair trade would be coming from TSLA, AAPL, GOOGL, or SNOW. And to be honest, all four would be good candidates. However, AAPL and TSLA are relatively close to their support levels, where demand might pick up. Maybe only temporarily, but still, I have to assume that it might stall any immediate further declines.
GOOGL or SNOW
That leaves GOOGL and SNOW for further inspection.
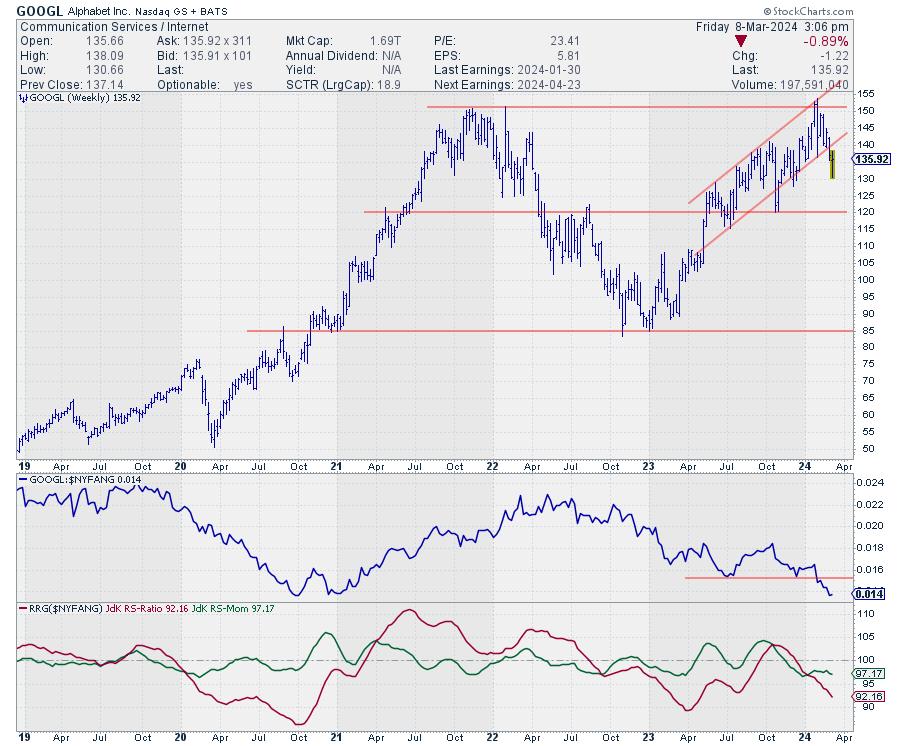
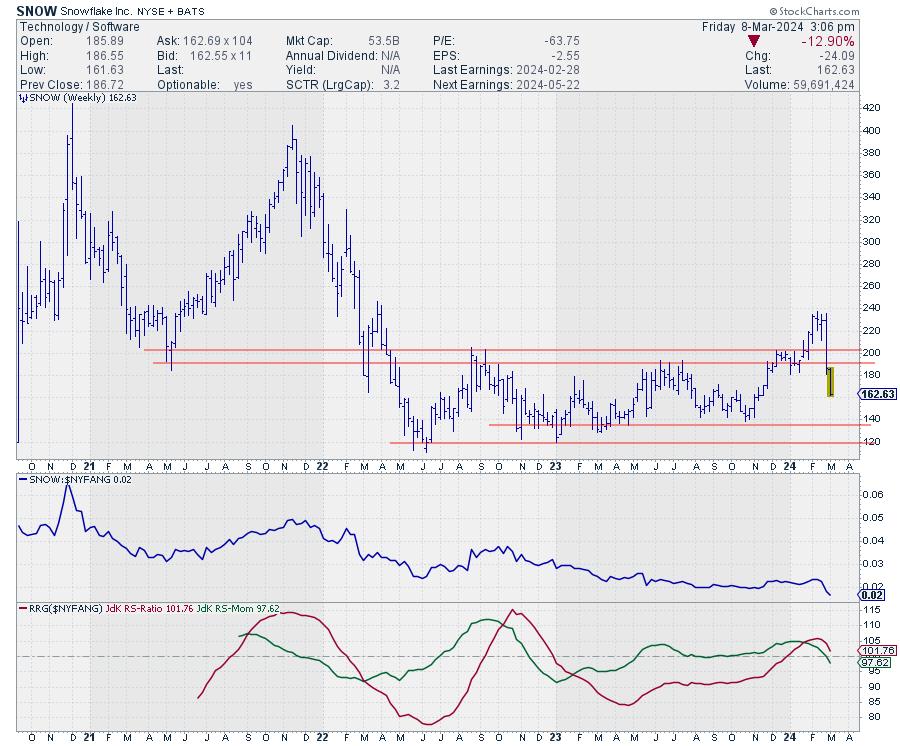
The downside risk/potential for both, towards their next support levels, is quite similar, around 12-13%. However, the tail for GOOGL is already well inside the lagging quadrant and has just confirmed the already existing downtrend in relative strength by breaking below its previous relative low. This makes me lean a bit more toward GOOGL as the short candidate, but equally good arguments can be found for SNOW.
You could even think about a three-legged position, with NFLX on the long side and GOOGL and SNOW, each being half of the short side.
Such an approach would still get you "in the game" while being agnostic to general market direction.
#StayAlert and have a great weekend. --Julius
Julius de Kempenaer
Senior Technical Analyst, StockCharts.com
Creator, Relative Rotation Graphs
Founder, RRG Research
Host of: Sector Spotlight
Please find my handles for social media channels under the Bio below.
Feedback, comments or questions are welcome at Juliusdk@stockcharts.com. I cannot promise to respond to each and every message, but I will certainly read them and, where reasonably possible, use the feedback and comments or answer questions.
To discuss RRG with me on S.C.A.N., tag me using the handle Julius_RRG.
RRG, Relative Rotation Graphs, JdK RS-Ratio, and JdK RS-Momentum are registered trademarks of RRG Research.


