TAKEAWAYS
- Defensive sector rotation remains a concern.
- AMZN & TSLA are both strong, but XLY remains in relative downtrend.
- Large Cap Growth is the only segment on a strong RRG-Heading.
Concerns Remain
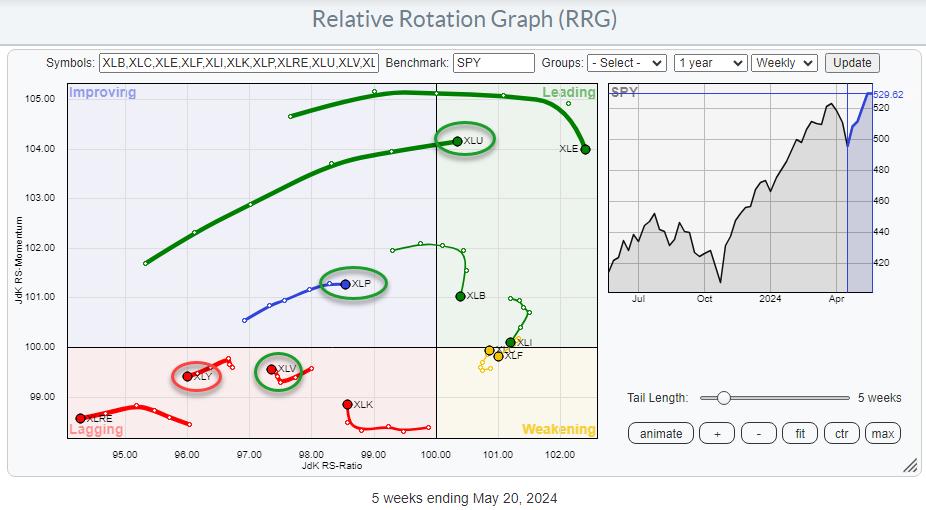
My concerns about current market developments, which I voiced in last week's article, are still valid. The current sector rotation, as it is visible on the relative rotation graph above, is not supportive of a strong rise in the S&P 500.
The strong headings, especially for the tails of XLU and XLP, suggest that the rotation to defensive sectors is ongoing. The pickup of relative momentum in the healthcare sector (XLV) adds to that observation. Another tail, which is not in line with a strong bull market in $SPX, is XLY, inside the lagging quadrant and traveling lower on the JdK RS-Ratio scale at a negative RRG heading.
AMZN & TSLA are Not Able to Pull the Sector Up
An interesting observation about the rotation of the consumer discretionary sector is that only two stocks—Amazon and Tesla—make up a large part of it. Together, they represent roughly 38% of the sector's total market capitalization. You usually see a huge impact of a few mega-/large-cap stocks on the direction of the sector as a whole, but that is not the case here.
Both stocks outperformed the Consumer Discretionary Index, showing positive returns, over the past 5 weeks, while XLY was underperforming SPY.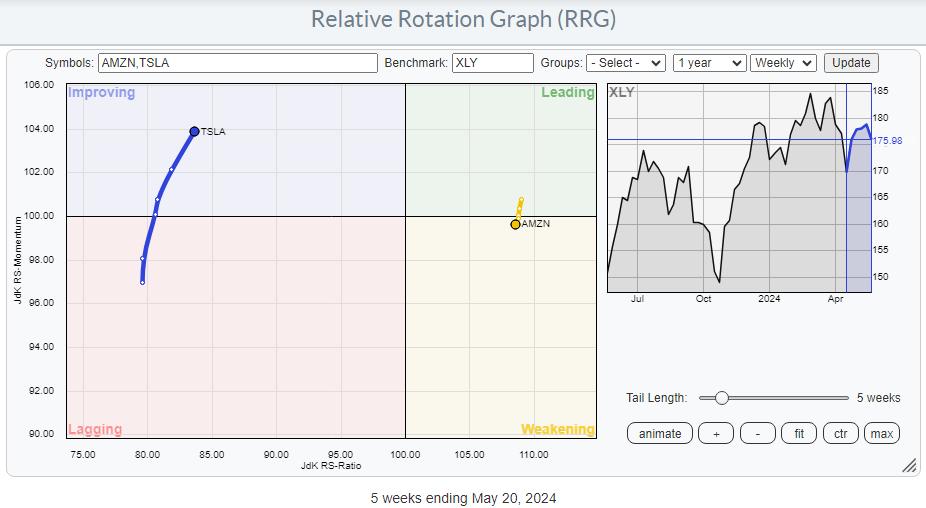
Both stocks are at different locations on the RRG, but both contribute positively. Amazon shows a very short tail and has just crossed from the leading quadrant into weakening. Its short tail indicates that this stock is in a stable relative uptrend. On the other hand, Tesla shows a longer tail and is moving from the lagging quadrant into improving, on a positive RRG heading.
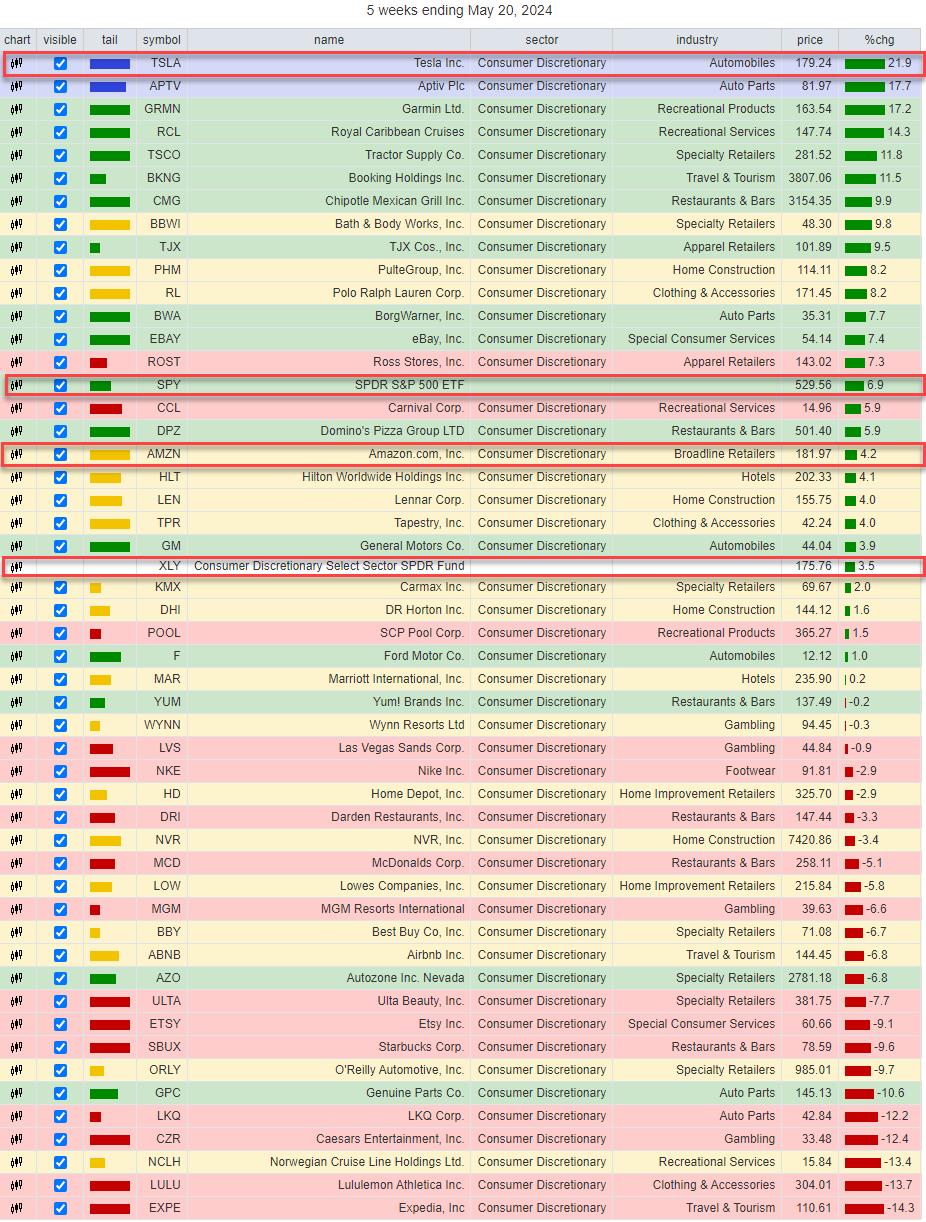
The performance table, which you can find below the relative rotation graph, highlights the differences in performance for the two stocks versus the consumer discretionary sector index. Tesla rose almost 22%, and Amazon added 4.2% over the last five weeks, while XLY only gained 3.5%. I have added SPY as a reference, which showed a performance of almost 7% over the same period.
So what does it mean when a large sector like consumer discretionary is underperforming the S&P 500 while 1/3 of its market capitalization is outperforming the sector?
It means that, under the hood, the situation for the sector as a whole is even worse.
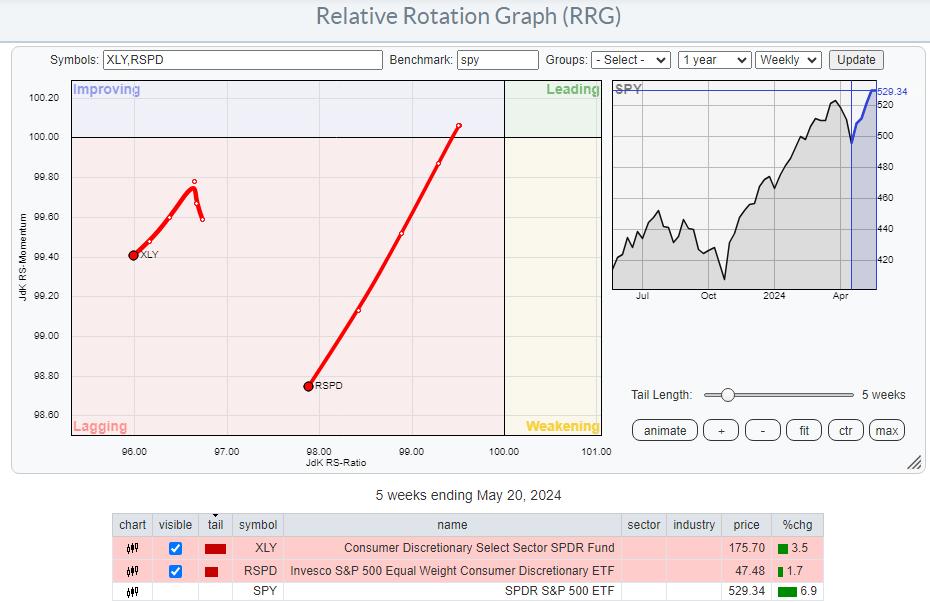
This can be visualized by using the equal-weight sector rotation instead of the cap-weighted sector rotation. The RRG above shows the tails for both XLY and RSPD using SPY as the benchmark. Both are well inside the lagging quadrant, but note the steepness of the tail for RSPD and its length compared to XLY.
Despite the lower reading on the RS-ratio scale for RSPD, the longer tail and the lower reading on the RS-momentum scale suggest that more relative downside is underway. So far, AMZN and TSLA have not been able to turn this situation around on a sector level.
Only Large-Cap Growth
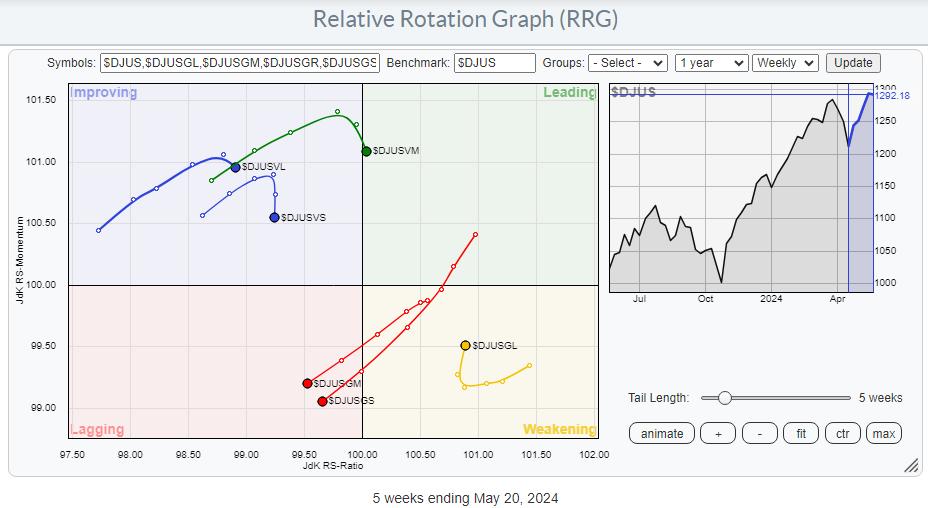
The last observation I want to share with you for this article is the difference in rotation between large-, mid-, and small-cap stocks across both the value and growth segments.
In the RRG above, we see large-cap growth as the only sector on a positive RRG-Heading, and inside, the weakening quadrant is on its way back toward the leading quadrant. This rotation suggests a new up-leg in an already established relative uptrend is underway.
ALL other tails are rolling over and rotating toward the lagging quadrant, or already in there.
This means that the current market strength is mainly driven by the large-cap growth segment, which includes NYFANG+ and MAG7 stocks that have a huge impact on the performance of $SPX.
So far, it's working out alright, but for how long? As always, this discrepancy could resolve itself in one of these two ways: either by the $SPX dropping in price to get back in line with the more defensive rotation or, and this is also a very possible scenario, a prolonged sideways move to digest recent gains. There is another option, however, in that the sector rotation could move toward more offensive sectors and mid- and small-cap segments, joining their large-cap counterparts in more positive territory on the RRG.
#StayAlert and have a great weekend. --Julius
Please note: Sector Spotlight has been discontinued, but I am back on the StockCharts.com YouTube channel with a weekly show, usually on Mondays.
Julius de Kempenaer
Senior Technical Analyst, StockCharts.com
Creator, Relative Rotation Graphs
Founder, RRG Research
Host of: Sector Spotlight
Please find my handles for social media channels under the Bio below.
Feedback, comments or questions are welcome at Juliusdk@stockcharts.com. I cannot promise to respond to each and every message, but I will certainly read them and, where reasonably possible, use the feedback and comments or answer questions.
To discuss RRG with me on S.C.A.N., tag me using the handle Julius_RRG.
RRG, Relative Rotation Graphs, JdK RS-Ratio, and JdK RS-Momentum are registered trademarks of RRG Research.


