TAKEAWAYS
- SPY is pushing against resistance.
- The technology sector is out of favor, and semiconductors are a drag for it.
- NVDA is big, but it is not the only semiconductor stock.
It's All Still Relative
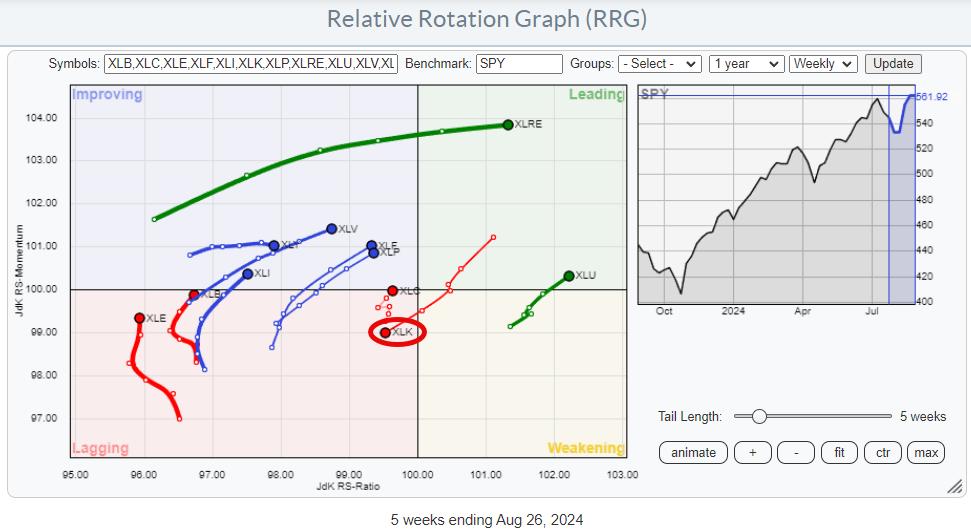
The weekly Relative Rotation Graph, as it looks toward the close of this Friday (8/30) shows a clear picture -- out of Technology, into everything else.
Simple enough, right? However, this is a relative comparison, so it only tells us whether a sector is in a relative up- or downtrend or whether its relative trend is improving or weakening. This means that when SPY starts to move lower, these sectors will likely outperform SPY, but their prices will still go down.
When just looking at the JdK RS-Ratio value as a gauge, there are only two sectors on the right-hand side of the graph with a reading above 100. These are Real Estate and Utilities. All other sectors are below 100 on the RS-Ratio scale and, therefore, technically still in a relative downtrend vs. SPY.
However, except for XLK, all these other sectors are on a positive RRG-Heading, between 0 and 90 degrees, which is a positive takeaway. There is still a risk that these tails may roll over while still inside the improving quadrant and continue their relative downtrend, but XLV, XLF, and XLP are looking especially strong, as they are getting close to crossing over into the leading quadrant.
XLY, XLI, XLB, and XLE are still too low on the RS-Ratio scale for consideration, imho.
SPY is Hitting Resistance
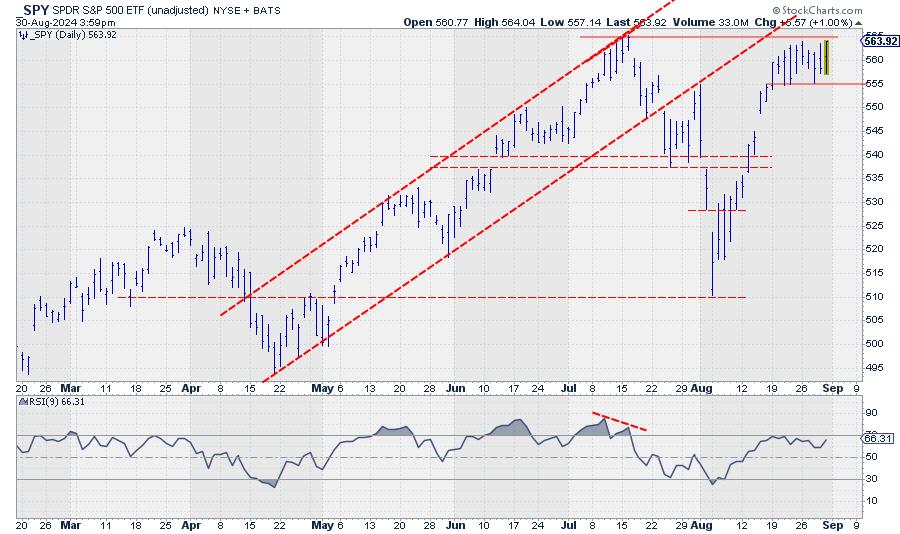
SPY pushing against resistance is creating an interesting situation. 565 is clearly a very important overhead resistance level for SPY. Only when this barrier can be convincingly broken will there be new upside potential for SPY to continue the longer-term uptrend. However, it is questionable whether SPY can break that barrier without the help of the technology sector. At the end of the day, that is now more than 30% of the total market capitalization of the S&P 500.
Over the last few weeks, SPY started to trade in a range between 555 and 565. When 555 gives way to the downside, significant downside risk will be unlocked, targeting the recent gap area between 545-548, followed by intermediate support around 537.5-540 and then 510, which is the level of the last major low.
Given the importance of the tech sectors in the current environment, I see the risk of a break below 555 as greater than the potential of a break above 565.
Semis / Tech Are Key
So, the tech sector, and especially the group semiconductors, will play an important role in the coming weeks to determine the faith direction of the general market.
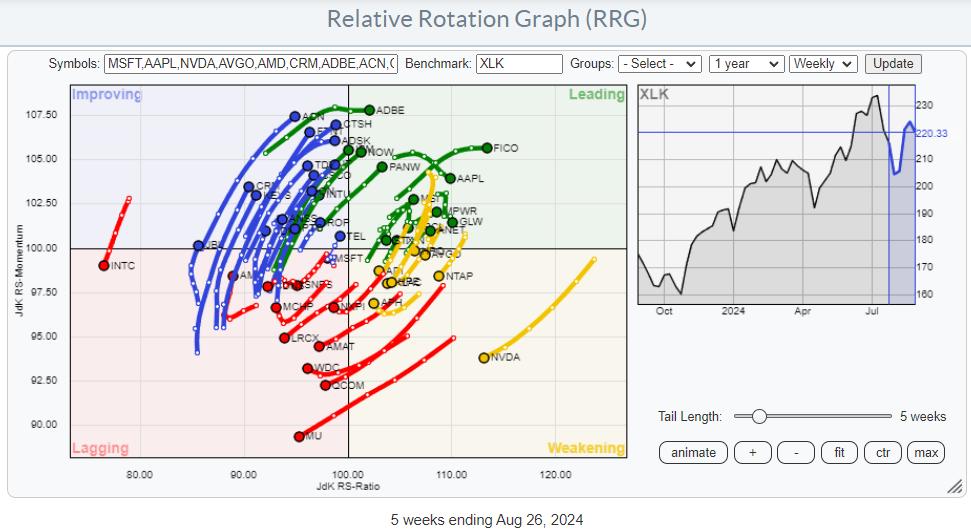
This RRG shows the members of the Technology sector. The big elephant NVDA is clearly visible inside the weakening quadrant and rotating toward the lagging quadrant at a negative RRG-Heading.
The semiconductors and semiconductor equipment group is now the largest industry inside the technology sector, weighing more than 40%. NVDA itself is now the second-largest stock in the technology sector, with a weight of 20%. So when it moves, it moves, making the industry and the sector move.
NVDA is BIG, But Not the Only Semiconductor Stock
When I isolate the semiconductor stocks on the RRG, we see this image:
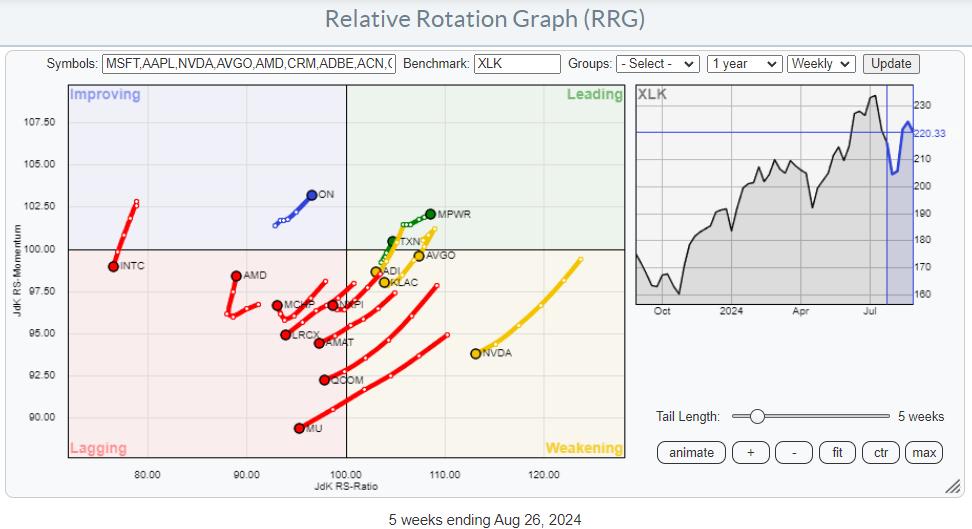
Most of these stocks are moving in the same direction as NVDA, on a negative RRG-Heading, weighing in on the industry and then on the sector. However, this is an extremely important group of stocks that deserves at least a minimal allocation in each portfolio "just in case it all turns around and starts to go up again." From that perspective, it makes sense to look for alternatives as long as NVDA is rotating on a negative heading, digesting its recent gains and relative outperformance.
Searching for stocks on a positive RRG-Heading provides a few potentials.
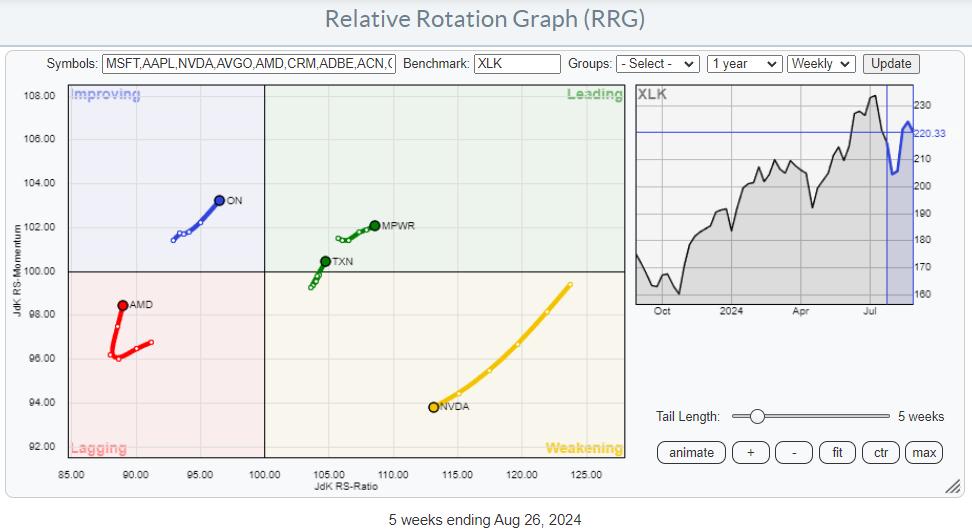
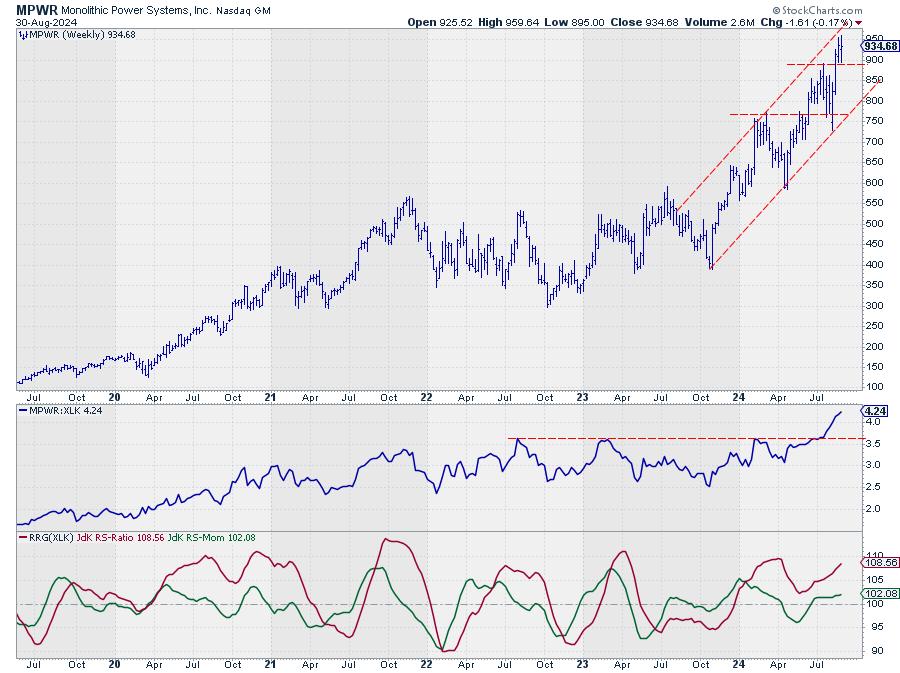
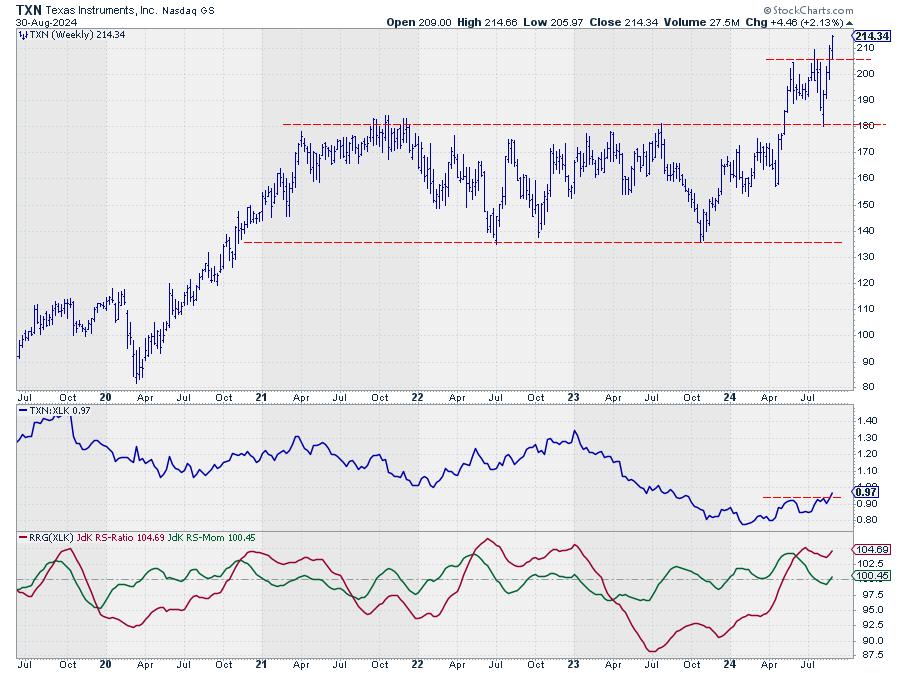
Combining the positions on the RRG and looking at the individual charts. MPWR and TXN could be interesting alternatives if NVDA maintains its negative RRG-Heading.
#StayAlert and have a great weekend. --Julius
Julius de Kempenaer
Senior Technical Analyst, StockCharts.com
Creator, Relative Rotation Graphs
Founder, RRG Research
Host of: Sector Spotlight
Please find my handles for social media channels under the Bio below.
Feedback, comments or questions are welcome at Juliusdk@stockcharts.com. I cannot promise to respond to each and every message, but I will certainly read them and, where reasonably possible, use the feedback and comments or answer questions.
To discuss RRG with me on S.C.A.N., tag me using the handle Julius_RRG.
RRG, Relative Rotation Graphs, JdK RS-Ratio, and JdK RS-Momentum are registered trademarks of RRG Research.


