TAKEAWAYS
- Sector rotation out of technology
- All other sectors are picking up relative strength
- Real-Estate, Utilities, and Financials showing strong rotations
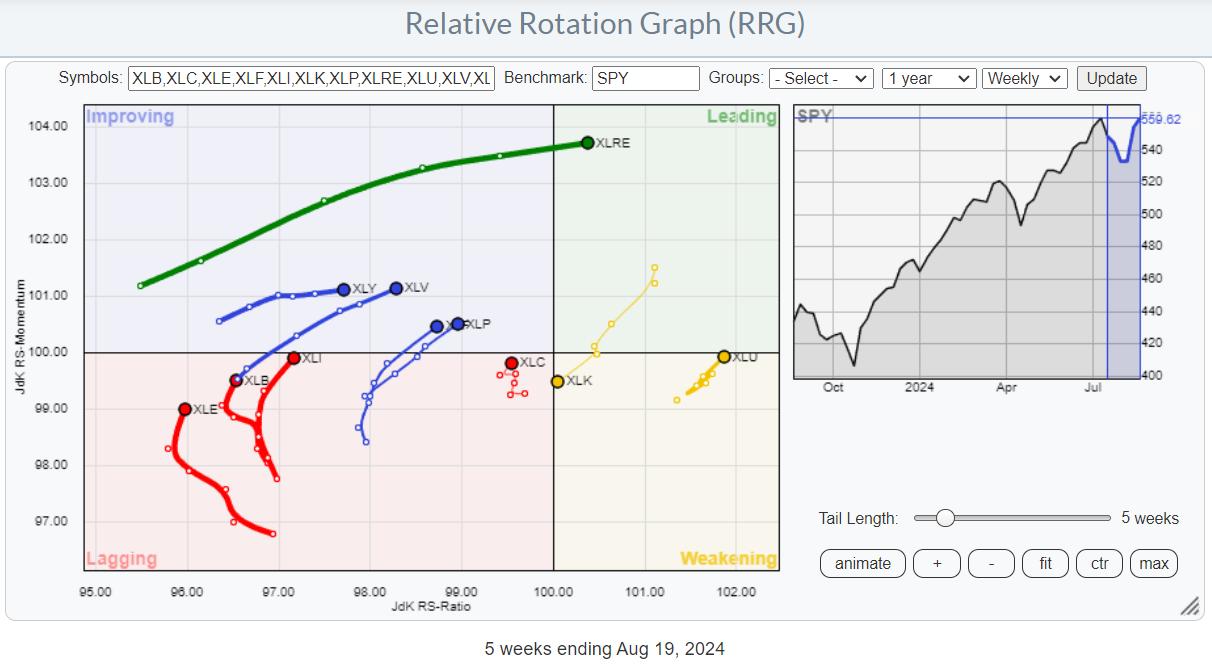
On the weekly Relative Rotation Graph, the rotation still favors almost every sector over Technology. I discussed the opposite rotations between weekly and daily RRGs in last week's video, which you can find here.
Real Estate
Working off this weekly chart, many tails are drawing attention to themselves. First of all, XLRE has the longest tail and is powering into the leading quadrant, showing that there is a lot of strength behind this move.
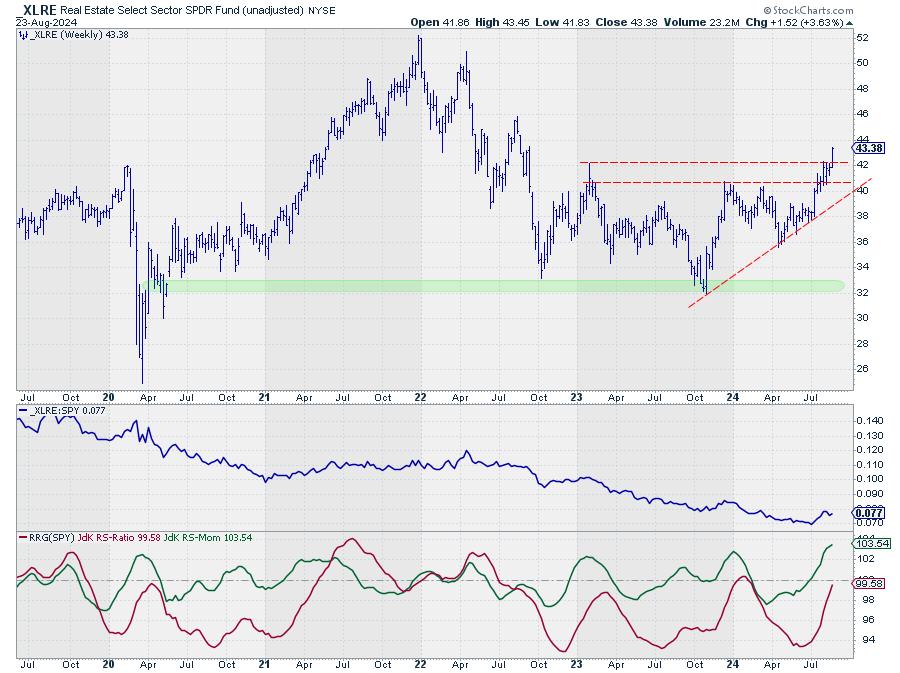
This is confirmed on the price chart, where XLRE is breaking above horizontal resistance, which frees the way for further appreciation. The next target for XLRE is the peak at 46, which was set in August 2022.
Utilities
The second one is Utilities, whose tail has sharply rotated back up toward the leading quadrant, signaling the start of a new up-leg within the already established relative uptrend.
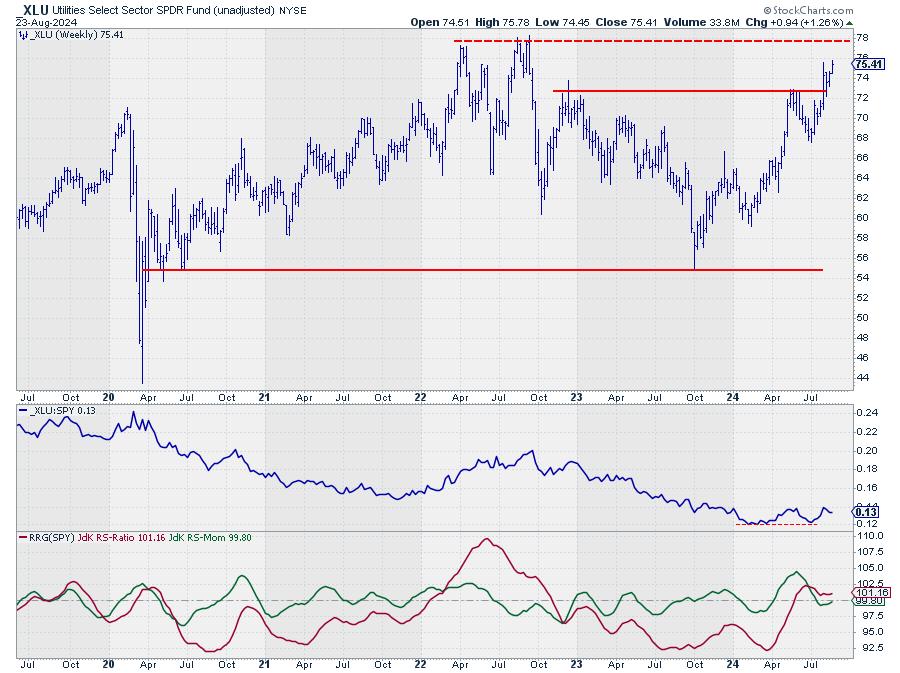
Utilities broke above horizontal resistance a few weeks ago and managed to hold up well, and they now seem to be accelerating higher, targeting the all-time-high level near 78.
The long downtrend in relative strength has stalled, with a potential double bottom in the making. The RRG-Lines are both bottoming out and starting to move higher.
Financials
The financials sector, XLF, is just crossing over into the improving quadrant from lagging as the price is breaking to new all-time highs.
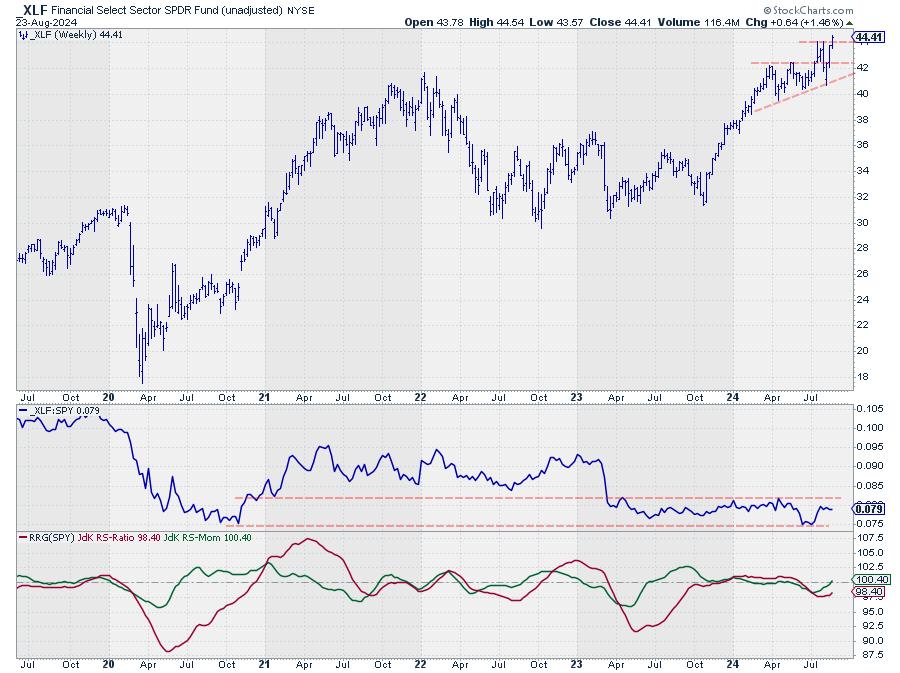
Relative Strength is still captured inside a long trading range, but is on its way to the upper boundary. That is causing the RRG-Lines to turn back up. JdK RS-Momentum has already exceeded 100, and JdK RS-Ratio is closing in on that level.
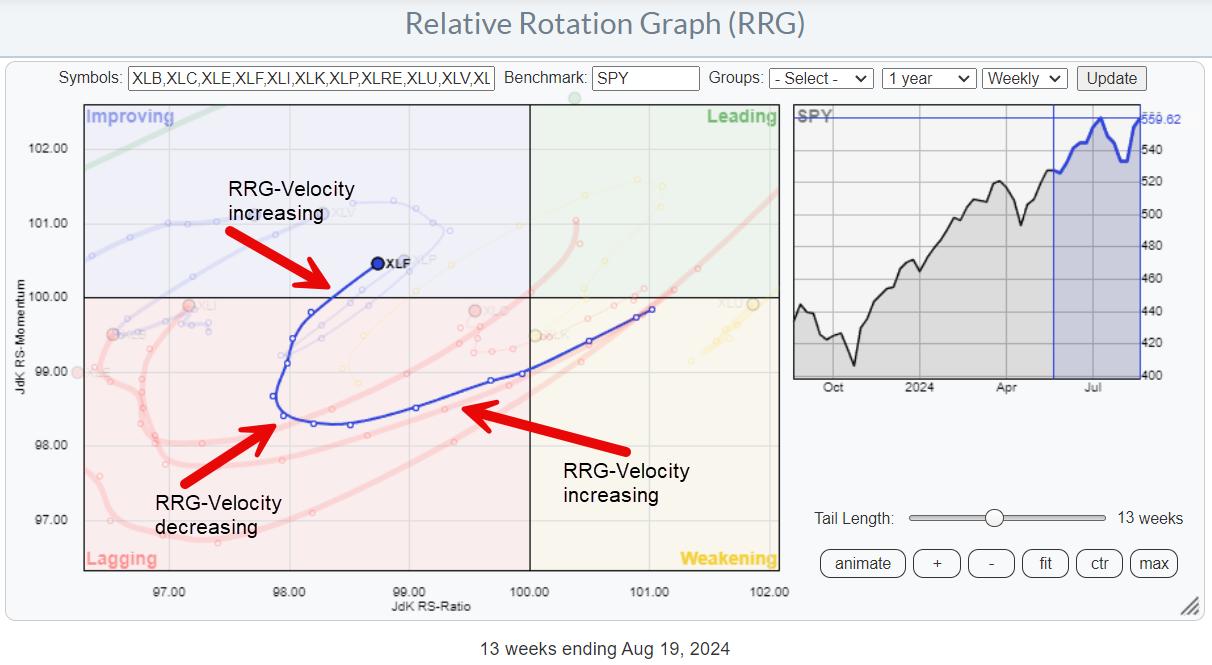
What is interesting about this particular tail is that it is getting longer. RRG-velocity* is increasing, which suggests an acceleration of the rotation.
*RRG-Velocity measures the distances between the nodes on a tail. By adding up distances, we can calculate the tail length, and by comparing the different distances, we can evaluate whether the rotation is speeding up or slowing down.
Financial - Industries
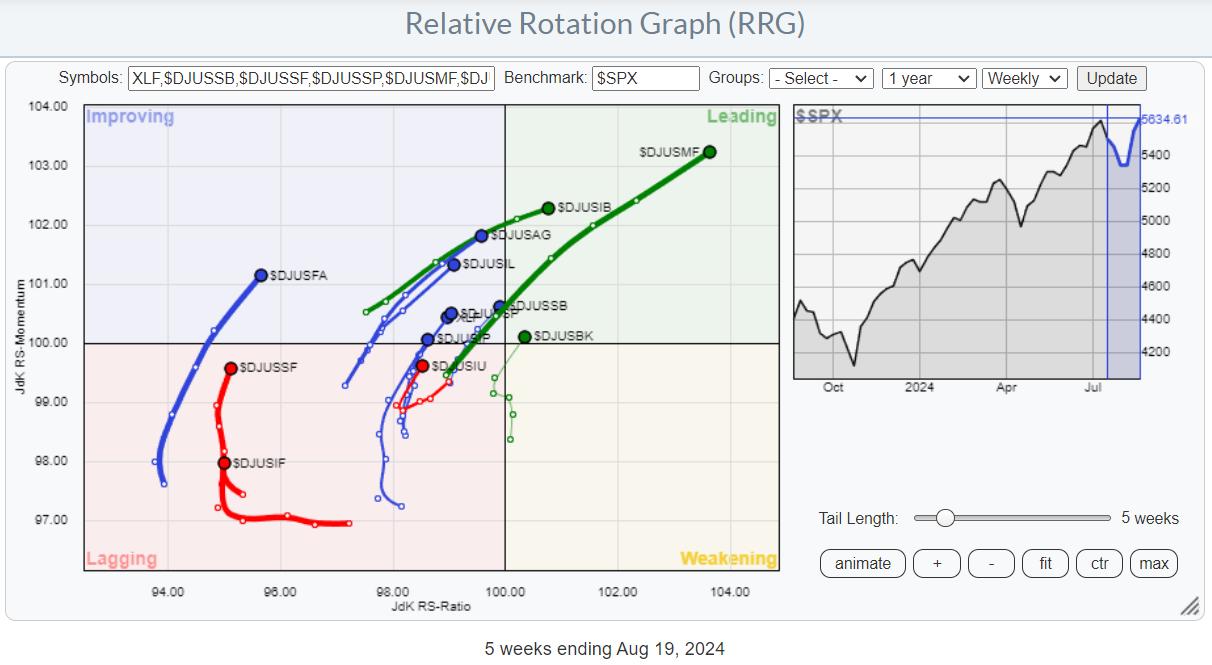
The RRG above shows the industries inside the financial sector against the S&P 500 as the benchmark. The improvement of relative strength is visible in all groups, as they are all on a positive RRG-Heading between 0-90 degrees. We need to change the benchmark to the financial sector index to find the most promising groups.
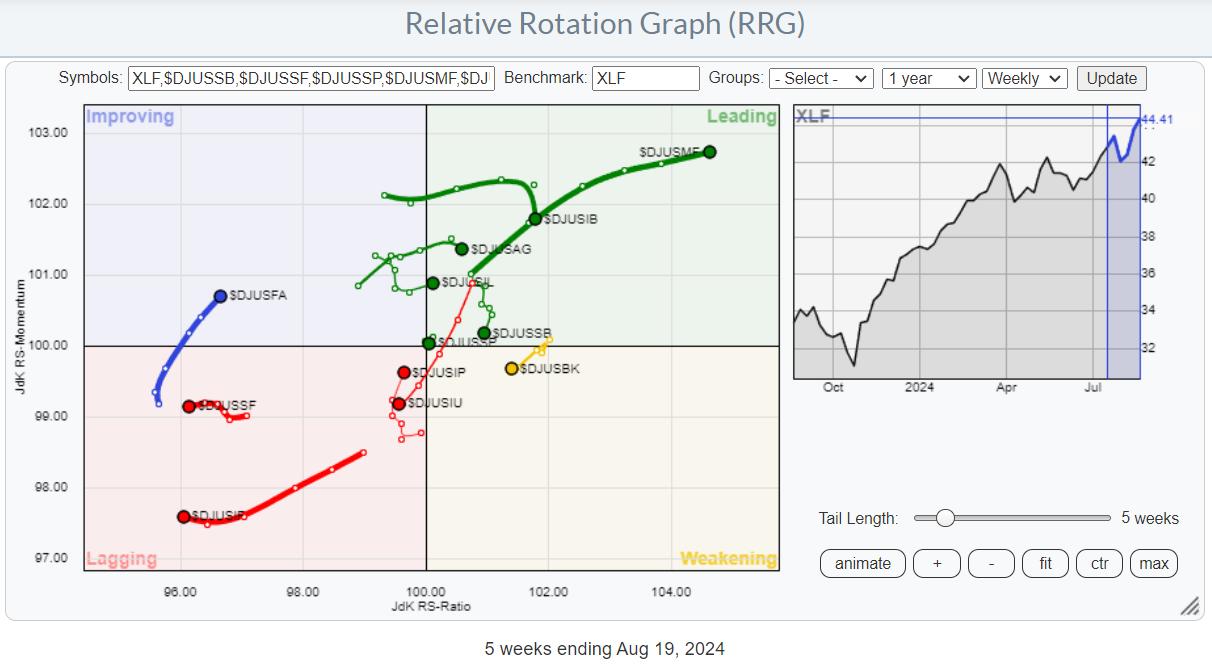
This gives a more balanced image of the various industries moving around the sector index (XLF). Where all the industries were on a positive RRG-Heading when benchmarked against $SPX, only four remain when using XLF as the benchmark.
Financial Administration
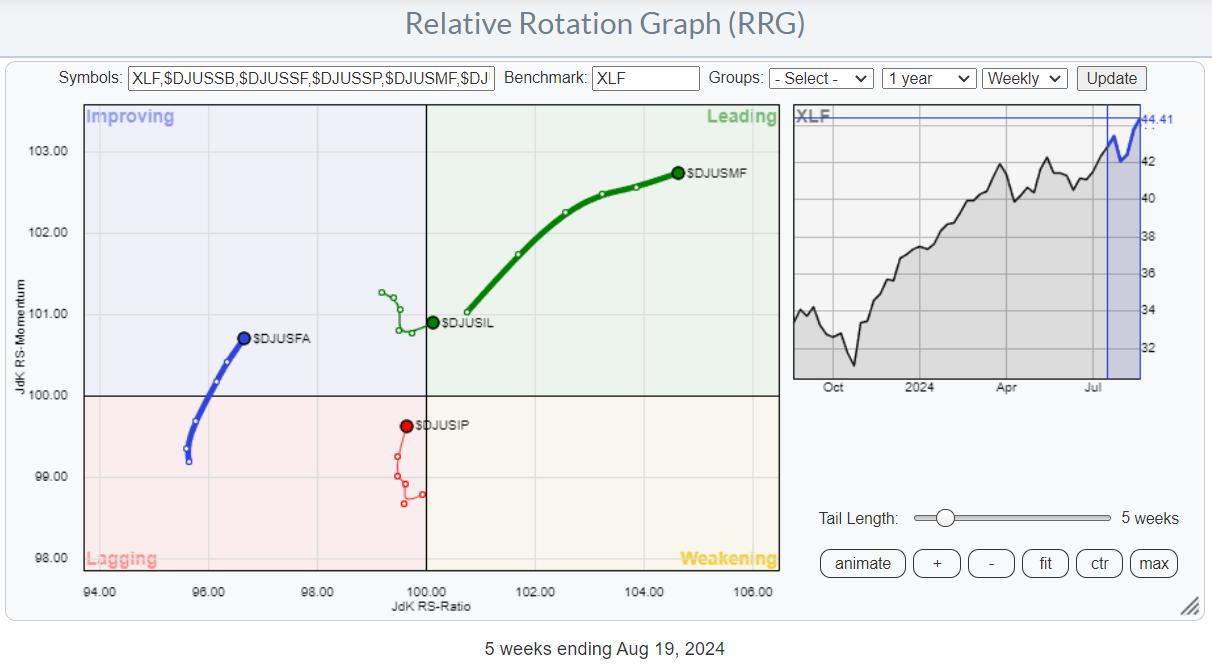
Going over the individual charts of these four groups, I like the one for $DJUSFA - Financial Administration.
This group halved in value from mid-2021 to mid-2022, then started trading in a range until now. This week, $DJUSFA closed above its previous high, clearing the path for a further rise. This price improvement has also led to an improvement in relative strength, with both RRG lines now rising. This makes it the group that could potentially lead the financials sector in the coming weeks.
This is a small group that holds only four S&P 500 stocks.
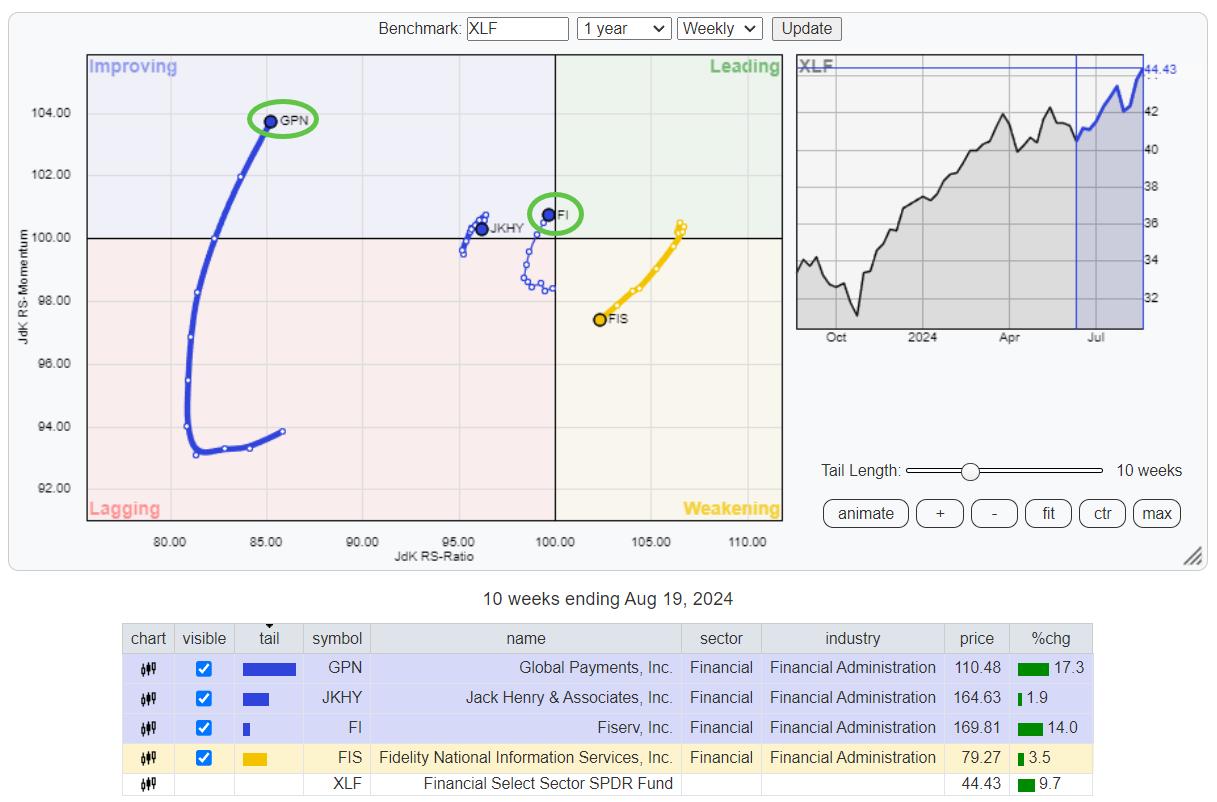
Out of these four, when compared to XLF, only FI and GPN show a positive rotation.
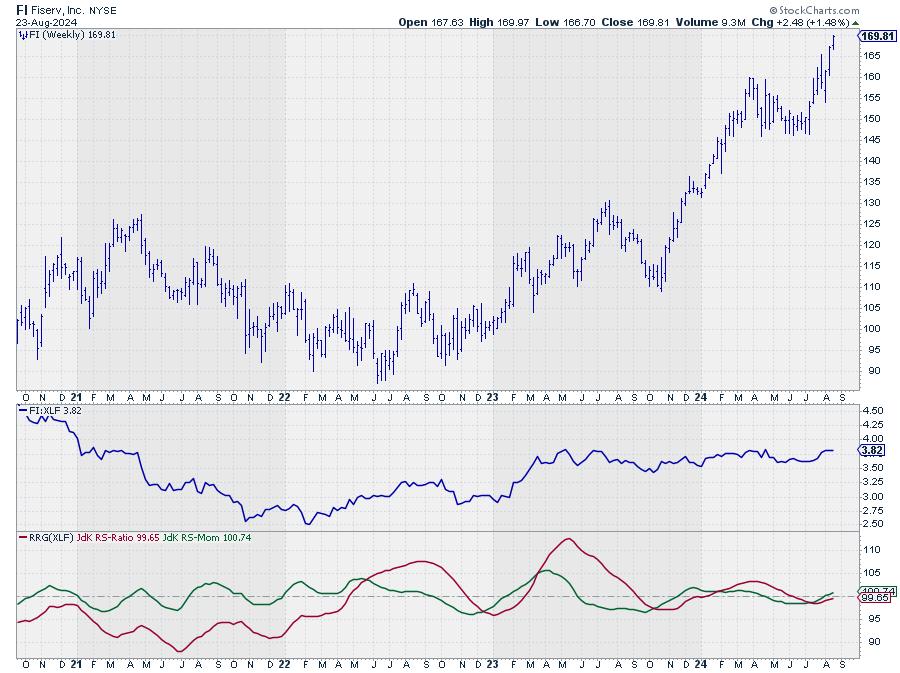
Fiserv recently confirmed its uptrend by breaking beyond its most recent peak, around 160, while relative strength seems ready to move out of its trading range.
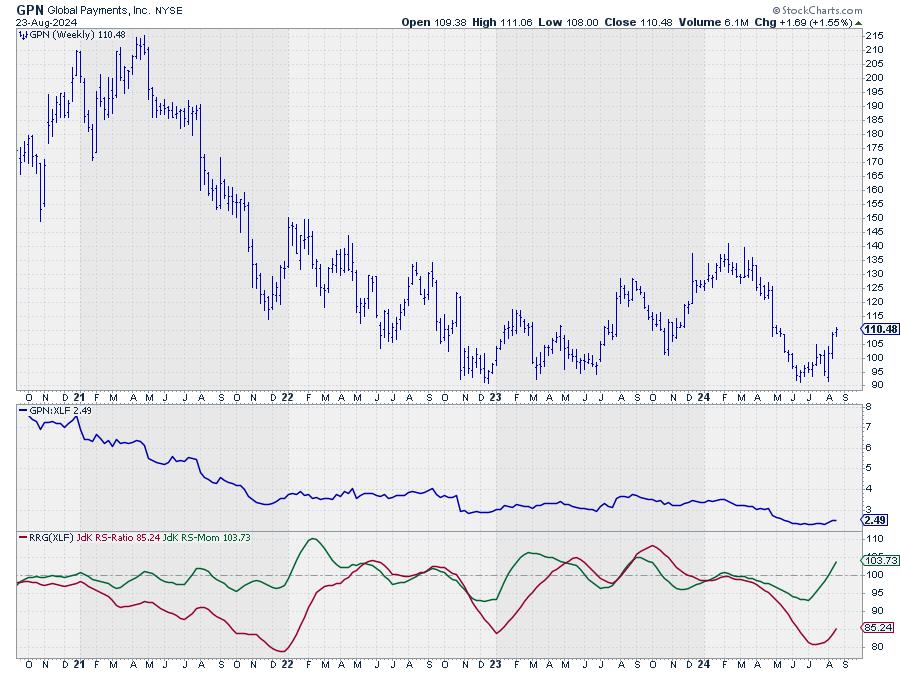
GPN tested solid support just above 90 twice this year and completed a double bottom from where price is now rallying. The upper boundary of a broad trading range can now be pegged near 140, creating well over 20% upside potential.
#StayAlert and have a great weekend. --Julius
Julius de Kempenaer
Senior Technical Analyst, StockCharts.com
Creator, Relative Rotation Graphs
Founder, RRG Research
Host of: Sector Spotlight
Please find my handles for social media channels under the Bio below.
Feedback, comments or questions are welcome at Juliusdk@stockcharts.com. I cannot promise to respond to each and every message, but I will certainly read them and, where reasonably possible, use the feedback and comments or answer questions.
To discuss RRG with me on S.C.A.N., tag me using the handle Julius_RRG.
RRG, Relative Rotation Graphs, JdK RS-Ratio, and JdK RS-Momentum are registered trademarks of RRG Research.


