TAKEAWAYS
- SPY is starting to resolve its negative divergence with RSI.
- Large-cap growth is coming back into favor.
- Magnificent 7 stocks provided 2.9% of the S&P 50's 6.8% performance over the past five weeks.
Where is the Recent Performance in the S&P 500 Coming From?
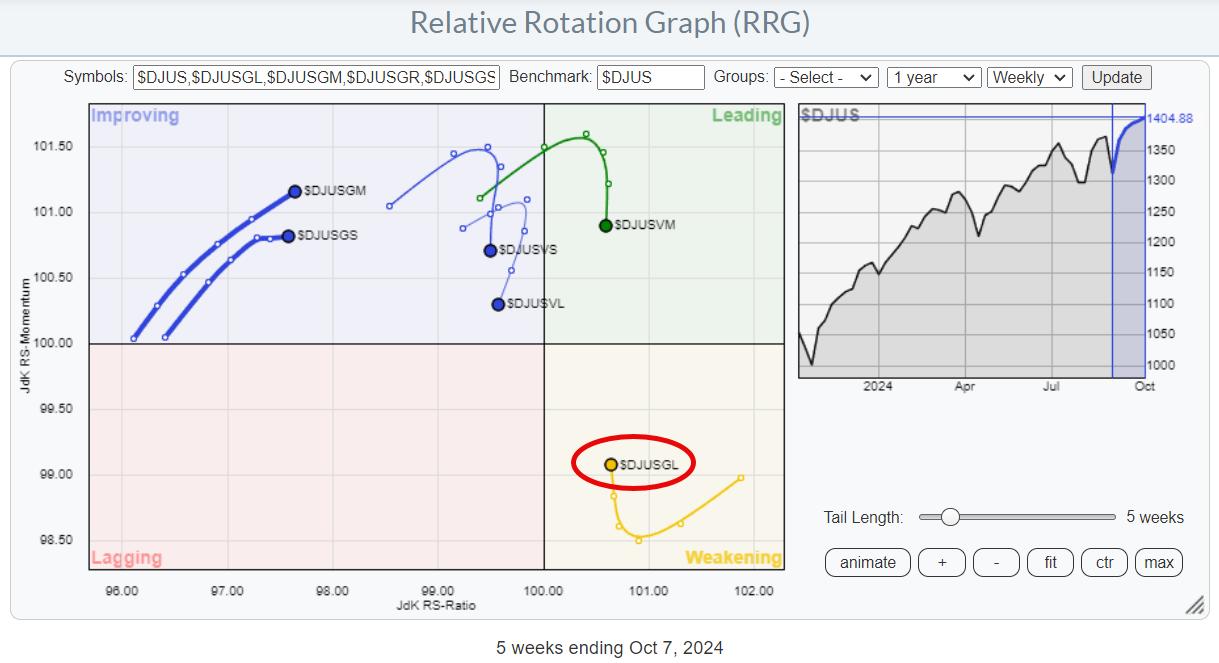
Let's start with the relative rotation graph (RRG) for growth and value sectors, dissected by size to get a clearer picture. The first RRG reveals a standout performer: the large-cap growth group. These stocks, which include major tech and communication services players, started their journey of outperformance in March 2023 when they moved to the right side of the RRG. Since then, they have completed multiple Leading-Weakening-Leading rotations and significantly contributed to the performance of the S&P 500.
The large-cap growth group, which includes the influential Mag-7 stocks, is currently in the weakening quadrant of the RRG. However, it's showing signs of curling up—a positive indication of a new upswing in an already established relative uptrend. In contrast, the other sectors, particularly the value ones across all sizes, are losing momentum and moving down on the JdK RS-momentum scale.
The mid-cap and small-cap growth groups are also lagging, with the lowest readings on the RS-ratio scale. They're far to the left, meaning they are still in relative downtrends, and the recent rally has to be judged as a recovery rally within a downtrend.
From this, the clear conclusion is that large-cap growth stocks are once again propelling the market upward.
Dissecting the Mag-7
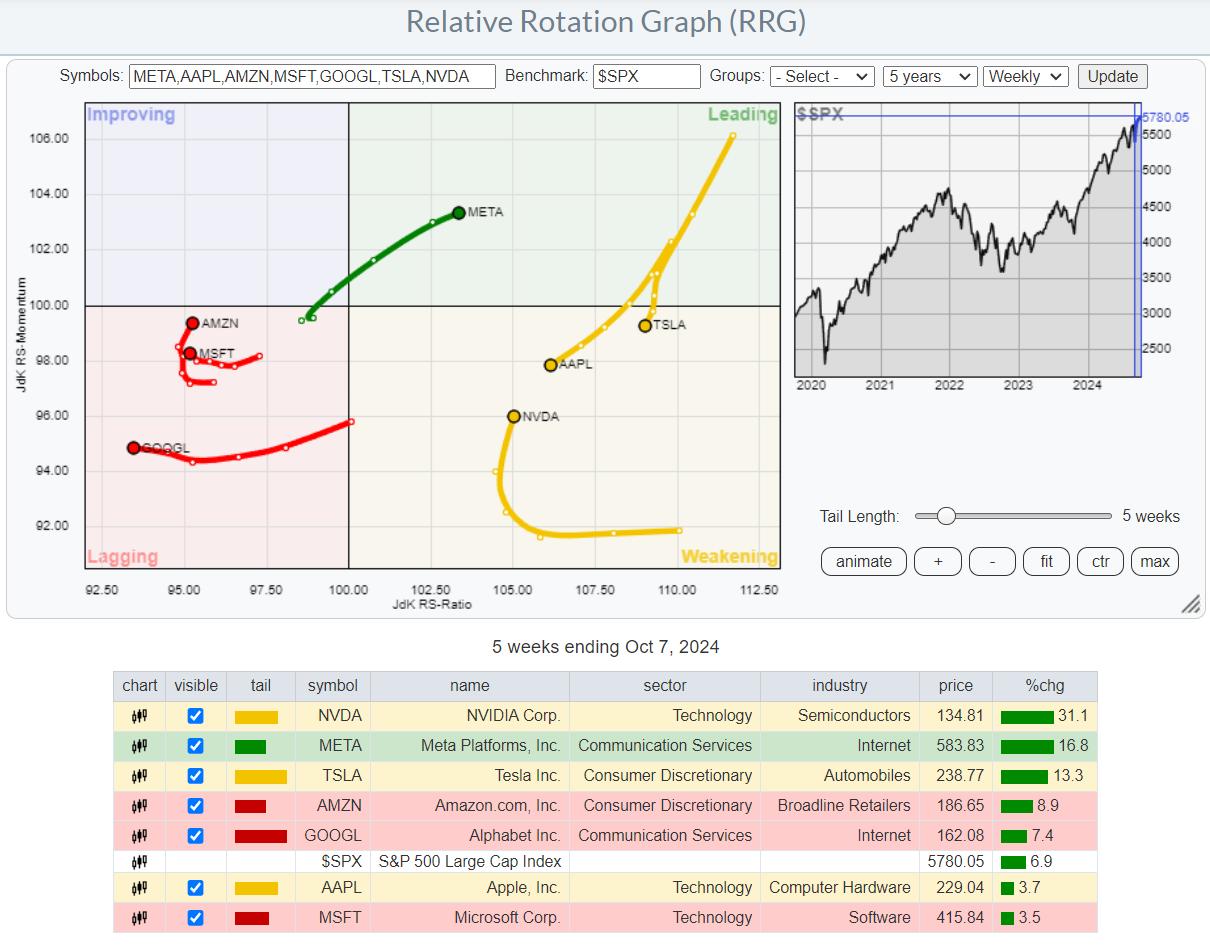
When we zoom in on the Mag-7 stocks and place them on an RRG, the disparity in their performance becomes evident. Meta and NVIDIA are the stars, with NVIDIA mirroring the large-cap growth index's position—inside the weakening quadrant but curling upwards, signaling another potential rise. Meta has made a full rotation and is now pushing deeper into the leading quadrant.
Apple and Tesla are on the right side of the graph. Tesla has outperformed the S&P 500 over the last five weeks, while Apple has not reached that level.
Amazon, Microsoft, and Google are in the lagging quadrant, with Google moving left, indicating a weak relative trend.
The Narrow Breadth of Market Performance is Back
This type of performance, driven by a small group of stocks, is a recurring theme. Over the last five weeks, the Mag-7 stocks have contributed over 2.9% to the S&P 500's 6.8% performance. That's a staggering 40% coming from just seven stocks—a clear example of a market with a narrow breadth.
This concentration continues to pose a risk, showing a market heavily reliant on a few key players.
SPY and its Divergences
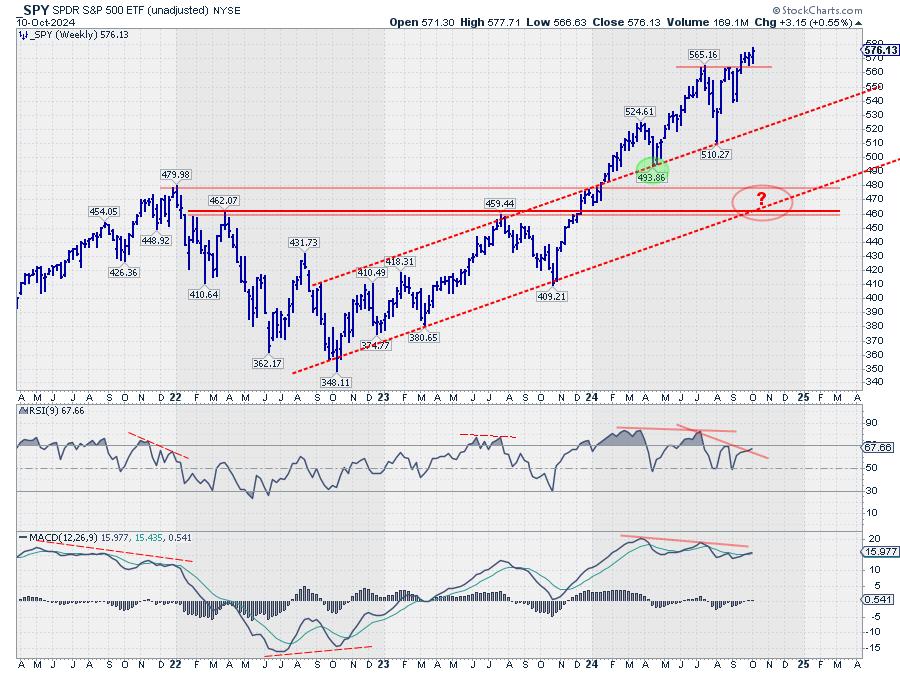
Turning to the S&P 500 charts, the weekly SPY chart shows signs of breaking the negative divergence in the RSI, which is a positive sign. However, the negative divergence with the MACD persists, indicating we're not out of the woods yet.
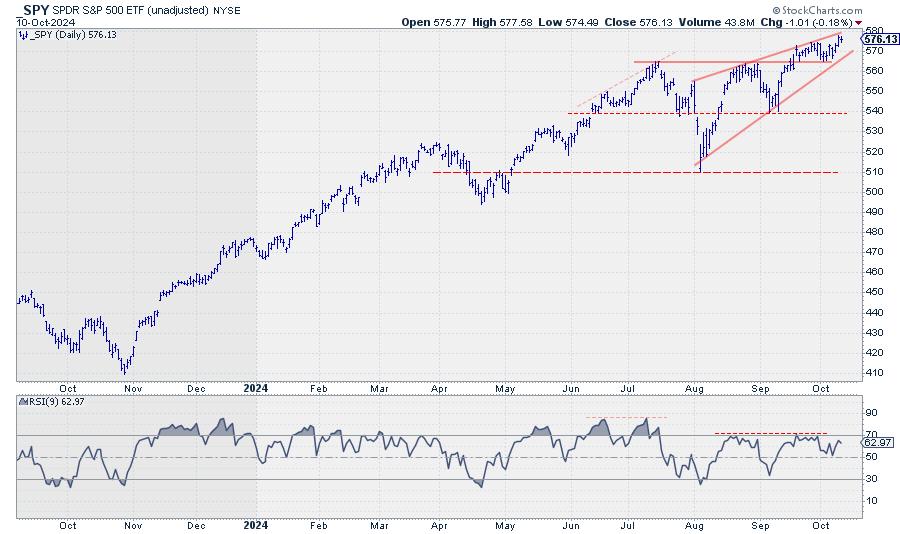
The daily chart suggests caution, as the S&P 500 is still within a potential rising wedge, and the RSI peaks are not showing the strength we'd like to see. The support level to watch remains 565.
A Closer Look at Individual Mag-7 Stocks
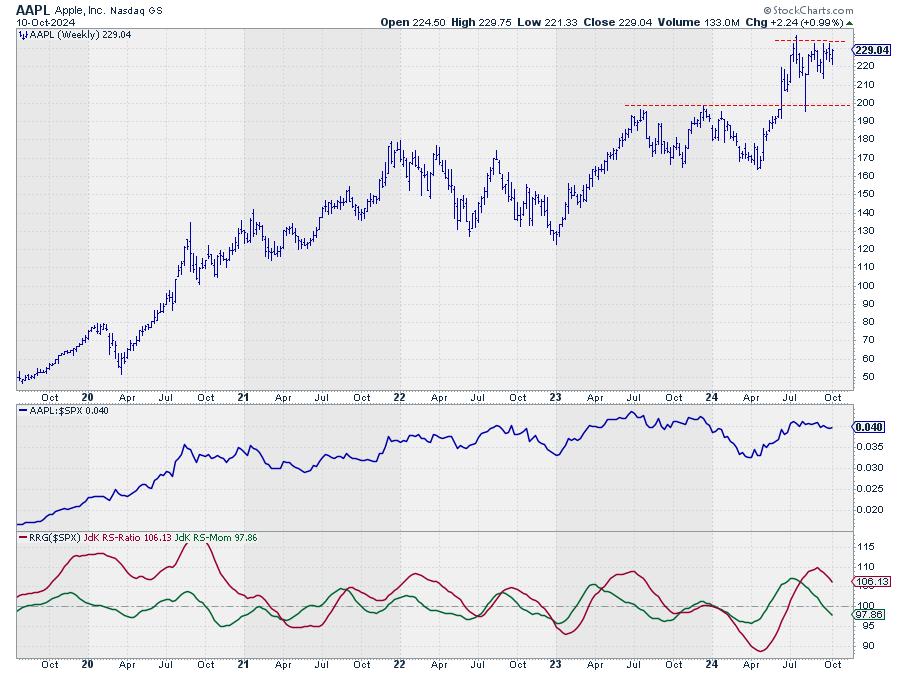
AAPL is still below overhead resistance, around the 230-235 area.
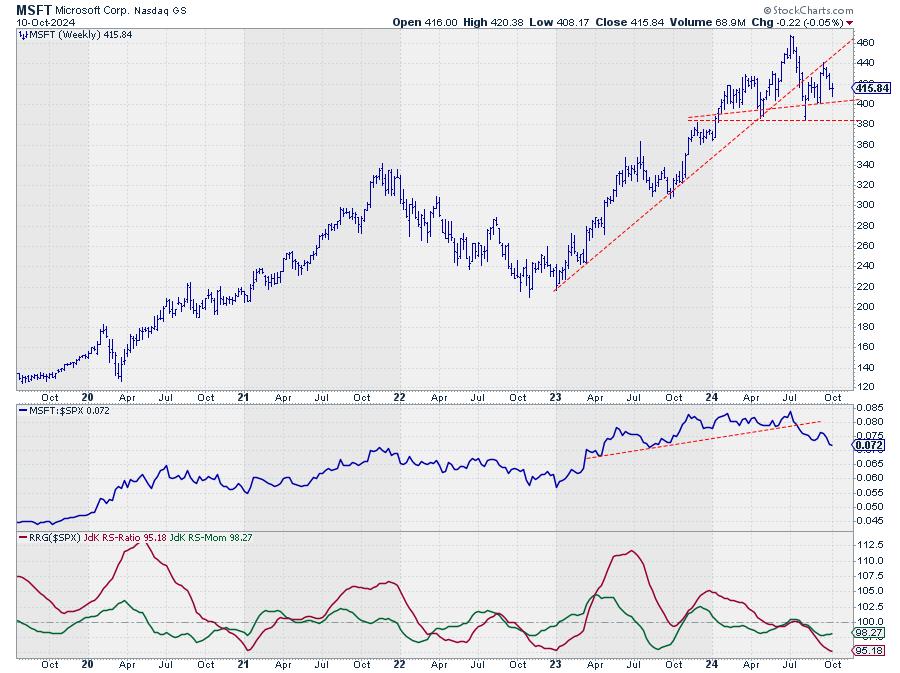
Microsoft has broken its uptrend, forming a potential head-and-shoulders top, The raw RS-Line is already in a downtrend.
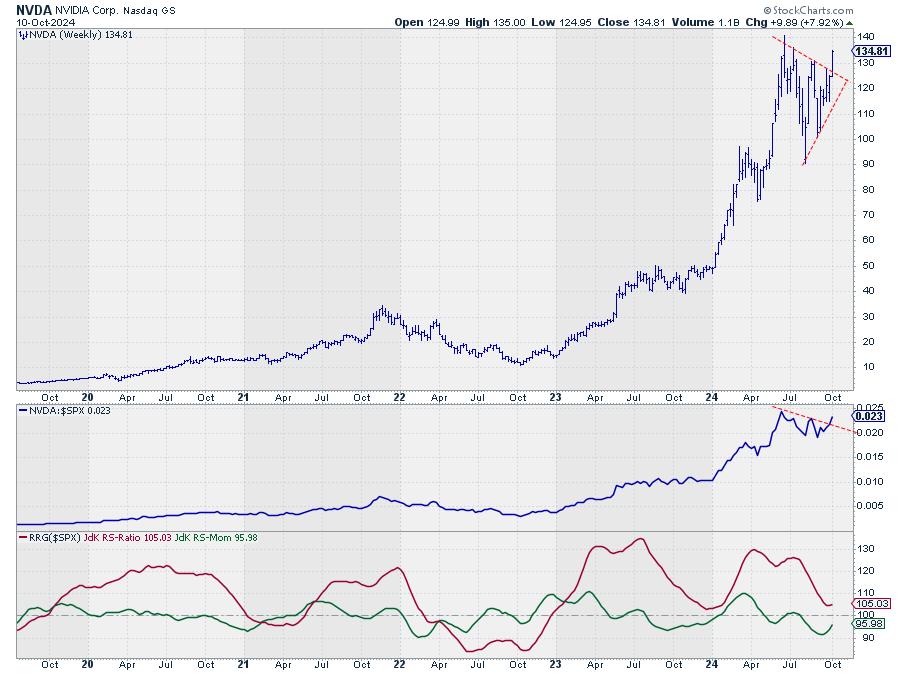
NVIDIA has broken out of a large consolidation pattern, indicating significant upside potential.
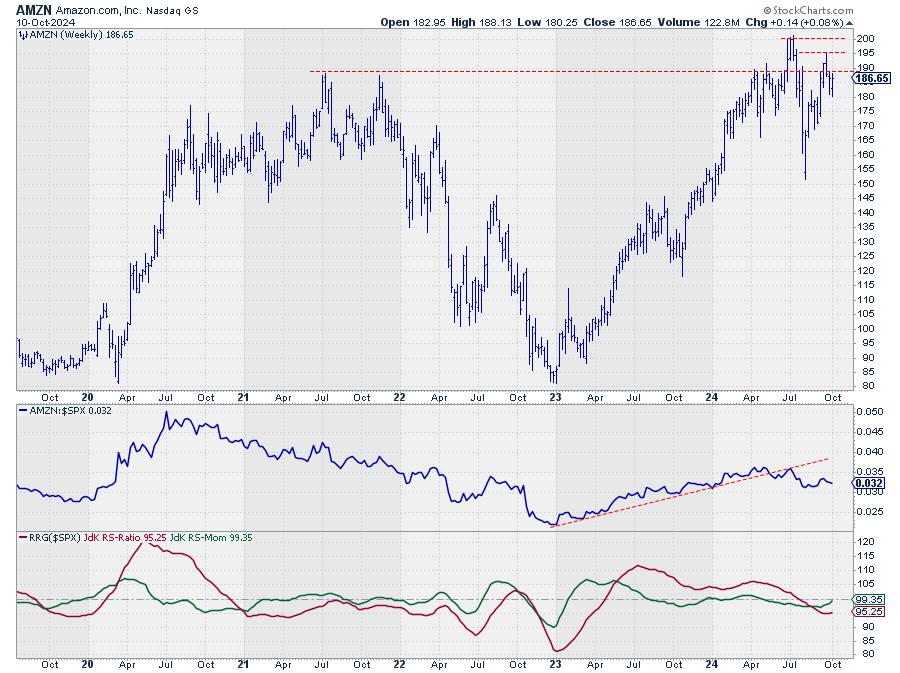
Amazon is below its all-time high and has recently marked a lower high on the weekly price chart, while raw-RS has broken its rising support line.

Meta has broken out to a new all-time high, signaling a strong and intact trend.
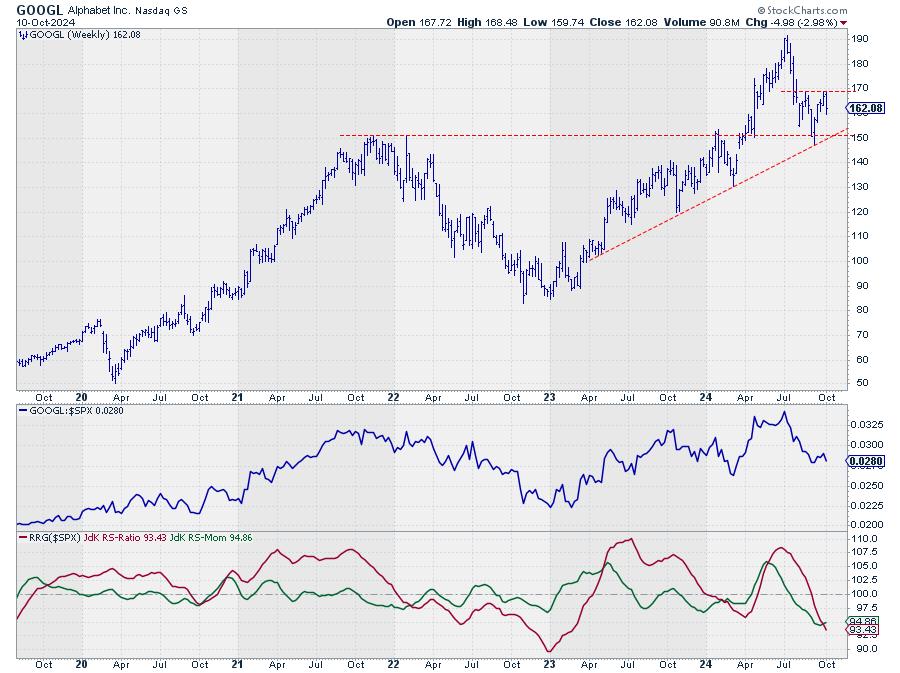
Google is rapidly heading into the lagging quadrant, with $150 as a critical support level.
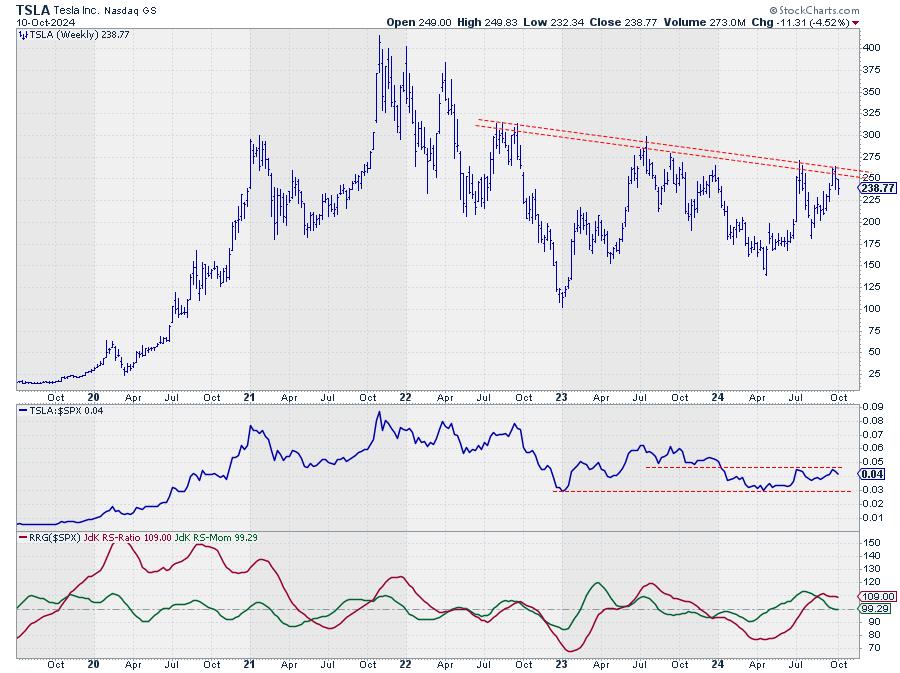
Tesla is in a volatile range below overhead resistance, which currently comes in around 270-275. This barrier needs to be taken out to trigger a new rally.
Conclusion: The Narrow Path to Market Gains
In summary, the large-cap growth stocks, particularly within the Mag-7, are driving the market higher on a very narrow foundation. Some divergences remain, but the S&P 500's ability to overcome the negative divergence between price and RSI is a small positive. The market's shape is improving as long as SPY remains above the 565 support level.
For a more sustained rally, we need broader participation from stocks outside the Mag-7. Until then, we will watch closely as Meta and NVIDIA lead the charge, while Google, Microsoft, and potentially Apple could dampen the S&P 500's performance.
It's still a tricky market, but with (some) large-cap growth stocks and their big impact on the broader indices, there are still opportunities to participate on the upside.
#StayAlert, --Julius
Julius de Kempenaer
Senior Technical Analyst, StockCharts.com
Creator, Relative Rotation Graphs
Founder, RRG Research
Host of: Sector Spotlight
Please find my handles for social media channels under the Bio below.
Feedback, comments or questions are welcome at Juliusdk@stockcharts.com. I cannot promise to respond to each and every message, but I will certainly read them and, where reasonably possible, use the feedback and comments or answer questions.
To discuss RRG with me on S.C.A.N., tag me using the handle Julius_RRG.
RRG, Relative Rotation Graphs, JdK RS-Ratio, and JdK RS-Momentum are registered trademarks of RRG Research.


