TAKEAWAYS
- No changes in top-5 sectors
- XLC showing strong break from consolidation flag
- XLE remains just barely above XLK as a result of strong daily RRG
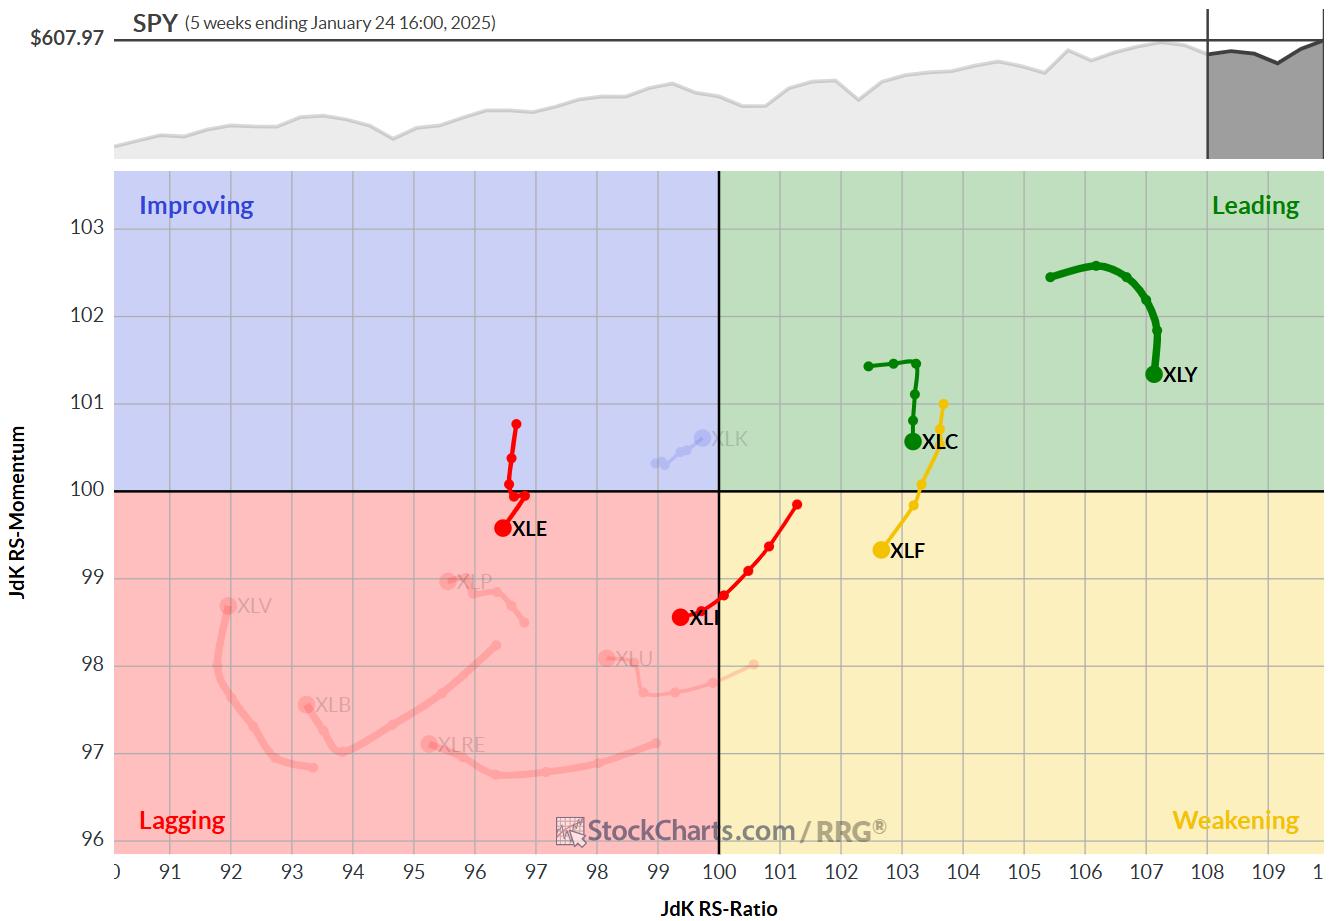
No changes in the top-5
At the end of this week, there were no changes in the ranking of the top-5 sectors.
- (1) XLY - Consumer Discretionary
- (2) XLF - Financials
- (3) XLC - Communication Services
- (4) XLI - Industrials
- (5) XLE - Energy
- (6) XLK - Technology
- (7) XLU - Utilities
- (11) XLB - Materials
- (8) XLRE - Real Estate
- (9) XLP - Consumer Staples
- (10) XLV - Health Care
In the bottom of the ranking, a few changes are showing up.
Materials rose from #11 to #8. XLRE dropped from #8 to #9. And XLP and XLV both dropped one position to #10 and #11.
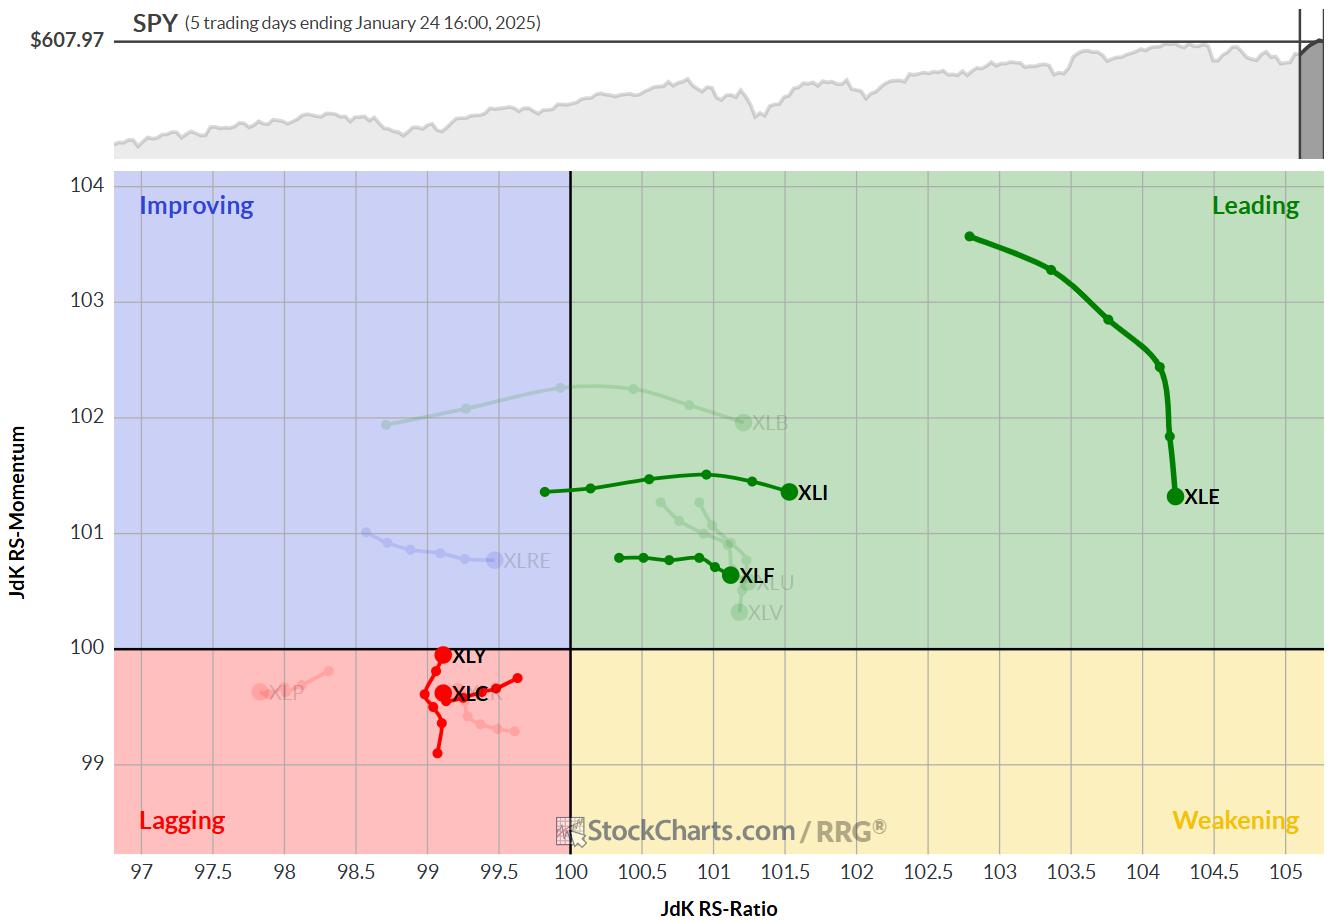
As a refresher, this ranking is done based on a combination of RRG metrics on both the daily and the weekly RRGs.
Based on the positions of XLE and XLK on the weekly RRG, it may seem strange that XLE is above XLK. However, looking at the daily RRG, it can be seen that XLE made a huge move into and through leading with a very high RS-ratio and RS-momentum reading, which dragged the sector above XLK.
Consumer Discretionary
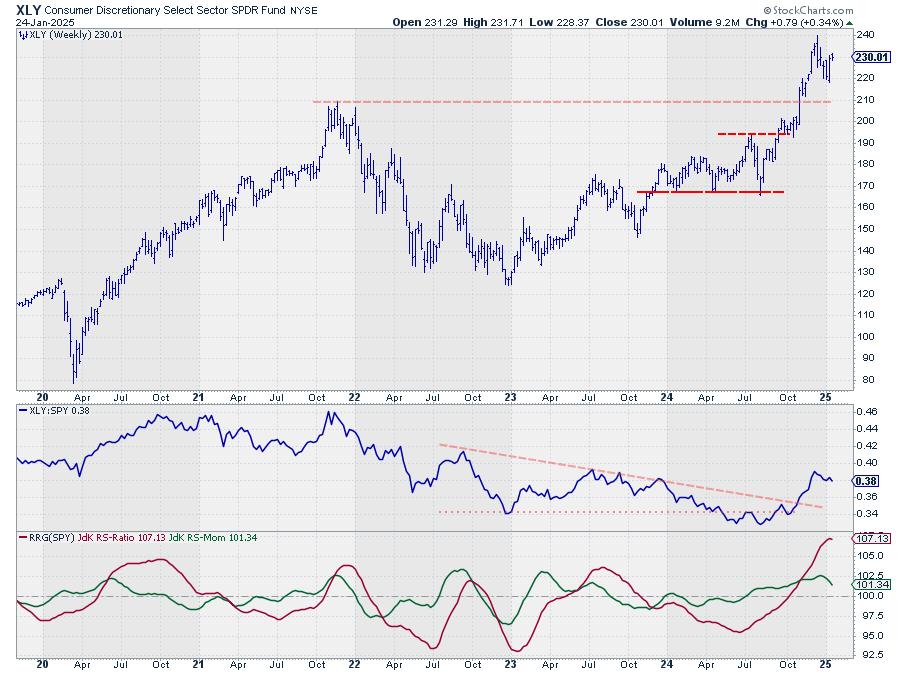
XLY has put a new higher low into place which underscores the current strength of this sector. The newly formed low at 218 is now the first support level to watch for XLY.
The first target to the upside is the level of the previous peak around 240. The uptrends in both price and relative strength are still intact.
Financials
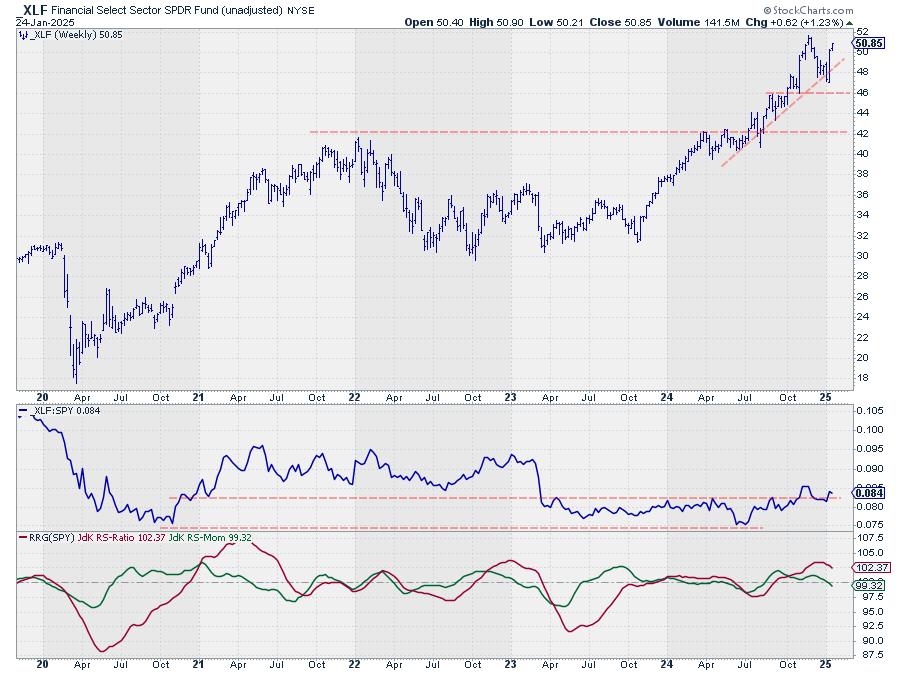
The Financials sector now also has a new higher low in place at 47, which should also be seen as the first support level for XLF.
51.6 is the first target and resistance level on the upside. An upward break will unlock more upside for financial stocks.
Communication Services
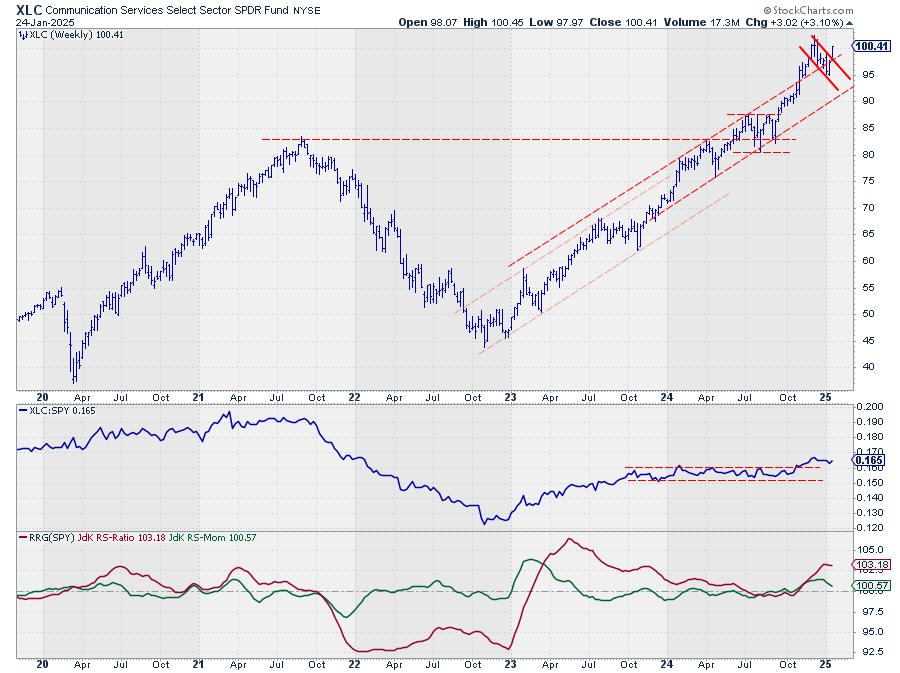
Out of the top-5 sector charts, XLC is probably the strongest.
This week's upward break out of the flag-like consolidation pattern must be seen as very strong and the signal for a further rally. Taking out the previous high at 102.40 will be the confirmation.
Industrials
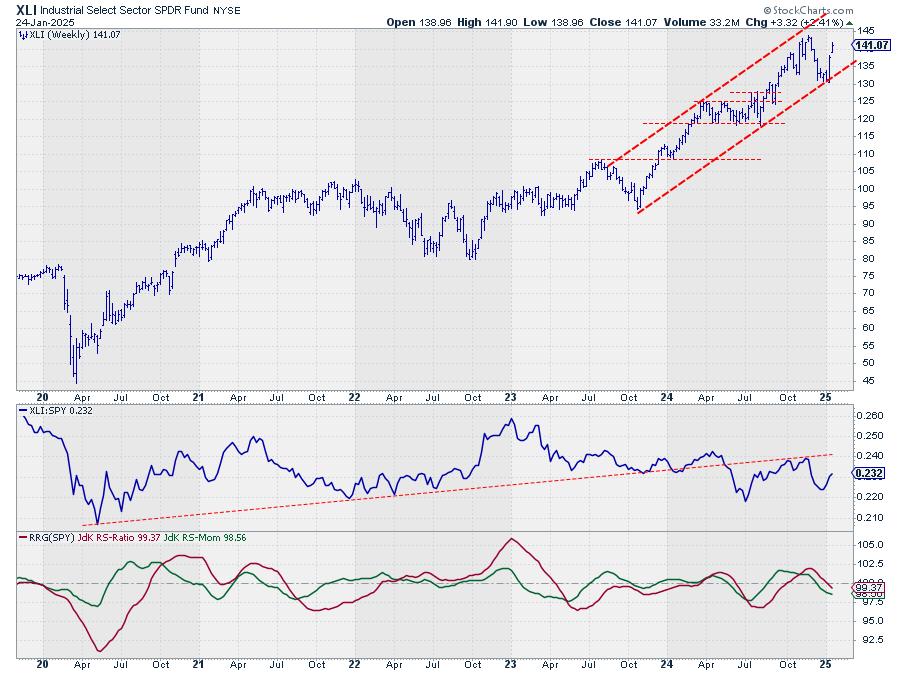
XLI continues its bounce of support and is underway to the upper boundary of its rising channel. Intermediate resistance is expected around 144.
Relative strength remains under pressure but is still stronger than the other sectors and therefore keeping XLI inside the top 5.
Energy
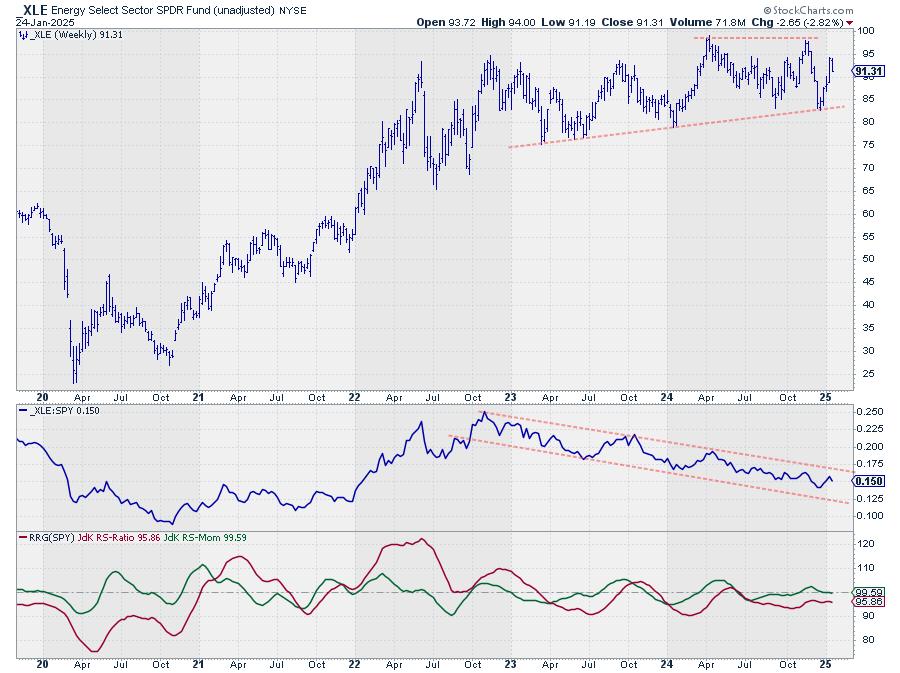
Energy dropped back a bit after its rally in the last few weeks but remains solidly in the middle of its range. Here also relative strength remains under pressure.
Performance
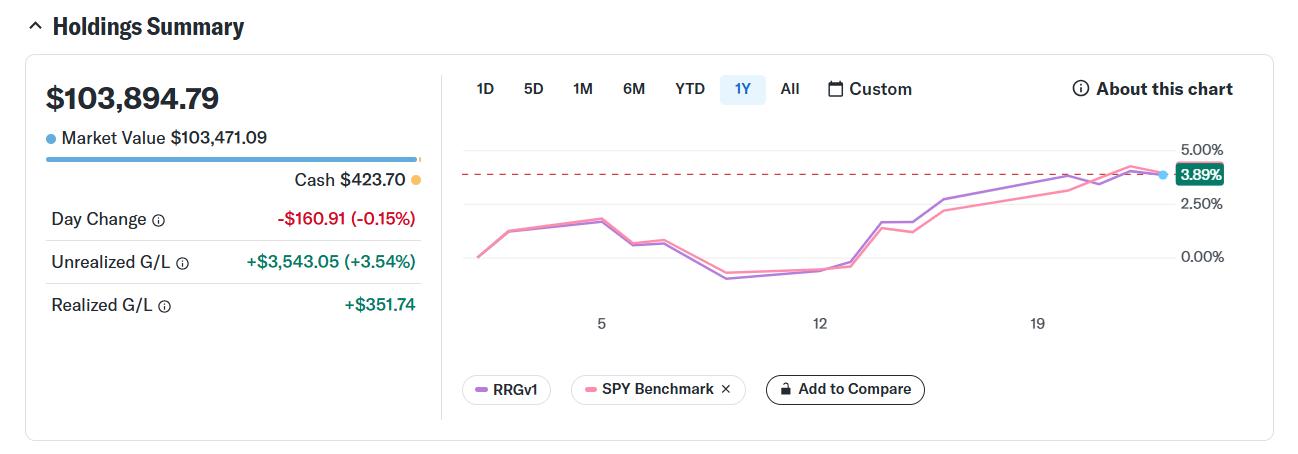
As of the close on 1/24 the top-5 portfolio gained 3.89%, keeping up with SPY which gained 3.99% over the same period.
#StayAlert, and have a great weekend. -- Julius
Julius de Kempenaer
Senior Technical Analyst, StockCharts.com
Creator, Relative Rotation Graphs
Founder, RRG Research
Host of: Sector Spotlight
Please find my handles for social media channels under the Bio below.
Feedback, comments or questions are welcome at Juliusdk@stockcharts.com. I cannot promise to respond to each and every message, but I will certainly read them and, where reasonably possible, use the feedback and comments or answer questions.
To discuss RRG with me on S.C.A.N., tag me using the handle Julius_RRG.
RRG, Relative Rotation Graphs, JdK RS-Ratio, and JdK RS-Momentum are registered trademarks of RRG Research.


