TAKEAWAYS
- Energy sector jumps to position #2 in top 5
- Consumer Staples drops out of portfolio
- Communication Services remains at #1 spot
- Modest pick up of relative momentum for XLK and XLY not enough yet
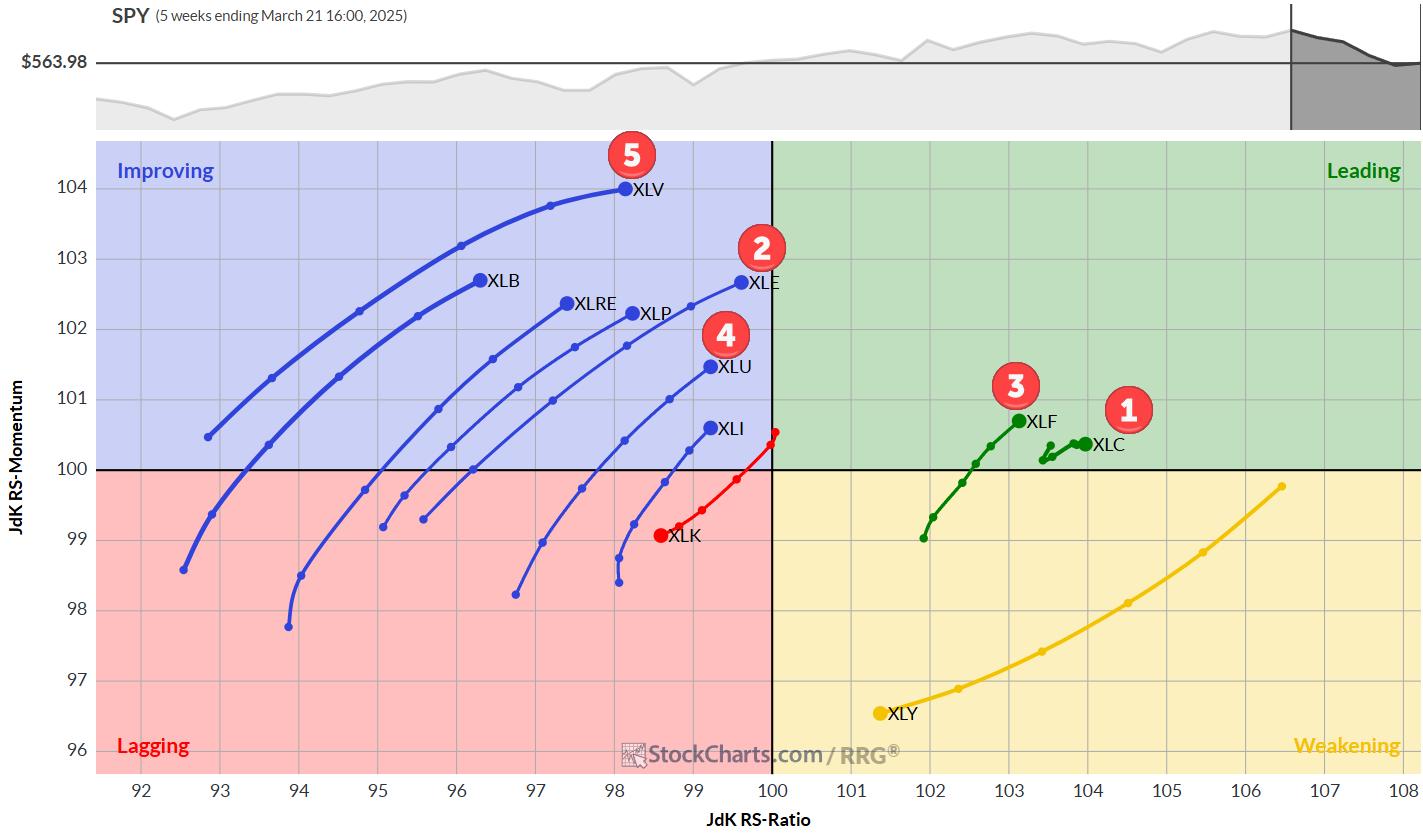
Energy Jumps to #2
A big move for the energy sector last week as XLE jumped to the #2 position in the ranking, coming from #6 the week before. This move came at the cost of the Consumer Staples sector which was pushed out of the top-5 and is now on #7.
Because of the jump of Energy, the Financials sector was pushed down to #3. Healthcare and Utilities remain in the top-5 but have switched positions.
The New Sector Lineup
- (1) Communication Services - (XLC)
- (6) Energy - (XLE)*
- (2) Financials - (XLF)*
- (5) Utilities - (XLU)*
- (4) Healthcare - (XLV)*
- (7) Industrials - (XLI)*
- (3) Consumer Staples - (XLP)*
- (8) Real-Estate - (XLRE)
- (9) Consumer Discretionary - (XLY)
- (10) Materials - (XLB)
- (11) Technology - (XLK)
Weekly RRG: XLF and XLC remain strong
On the weekly Relative Rotation Graph, Communication Services and Financials remain strong inside the leading quadrant. From the big cluster of tails inside the improving quadrant, XLE has jumped to the front of the queue (almost) while XLU and XLV continue to pick up nicely.
The long tail on XLY at a negative RRG-Heading rapidly continues to push the sector to the lagging quadrant. The Negative RRG-Heading on XLK keeps the sector at the bottom of the list.
Daily RRG: Modest Pickup of Relative Momentum for XLK and XLY
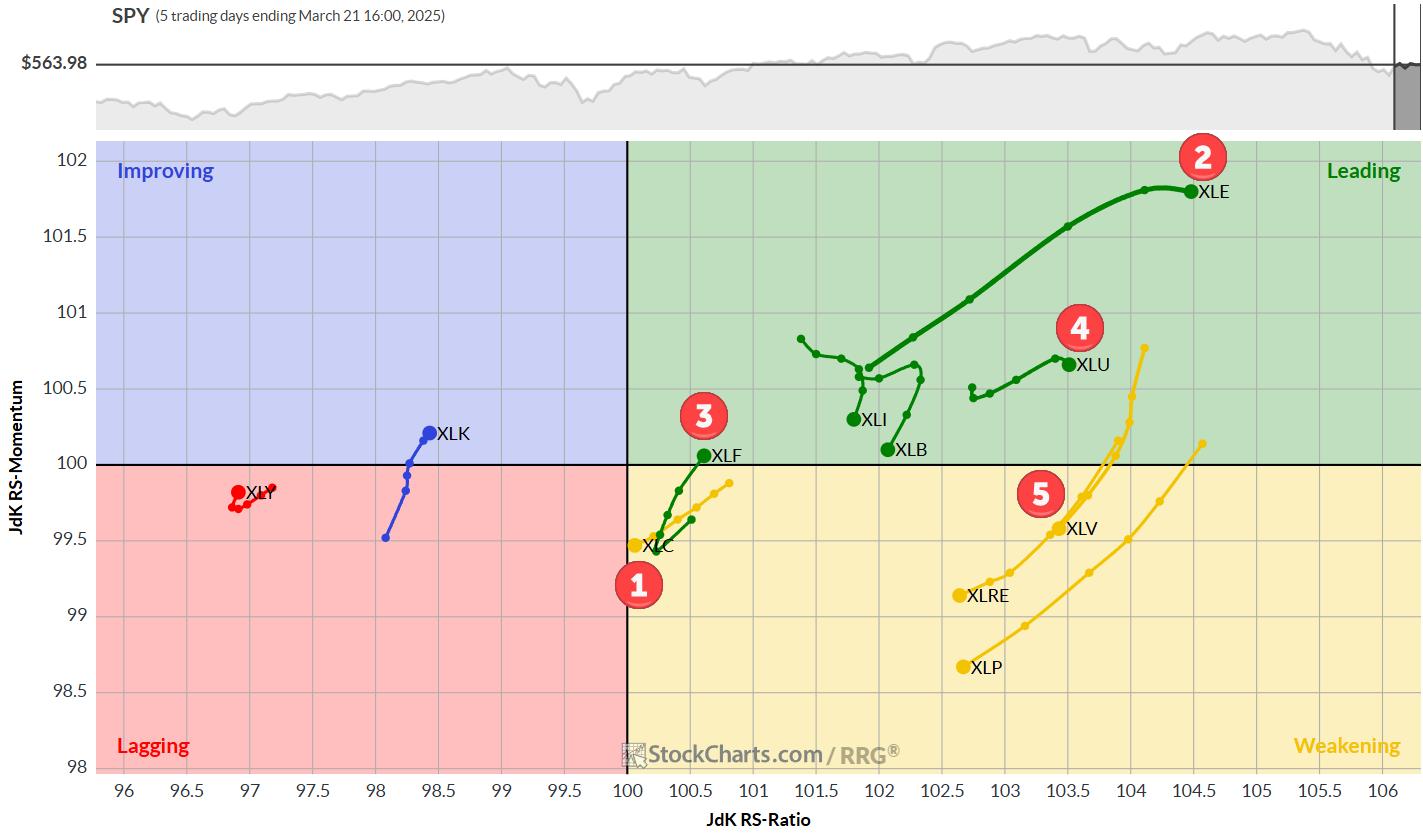
On the daily RRG:
- XLE jumps to the highest RS-Ratio reading while maintaining the highest RS-Momentum.
- Utilities stall inside the lagging quadrant
- XLV rotates into weakening but remains at an elevated RS-Ratio reading
- XLF rotates back into the leading quadrant, signaling the start of a new leg in the already established relative uptrend.
Communication Services
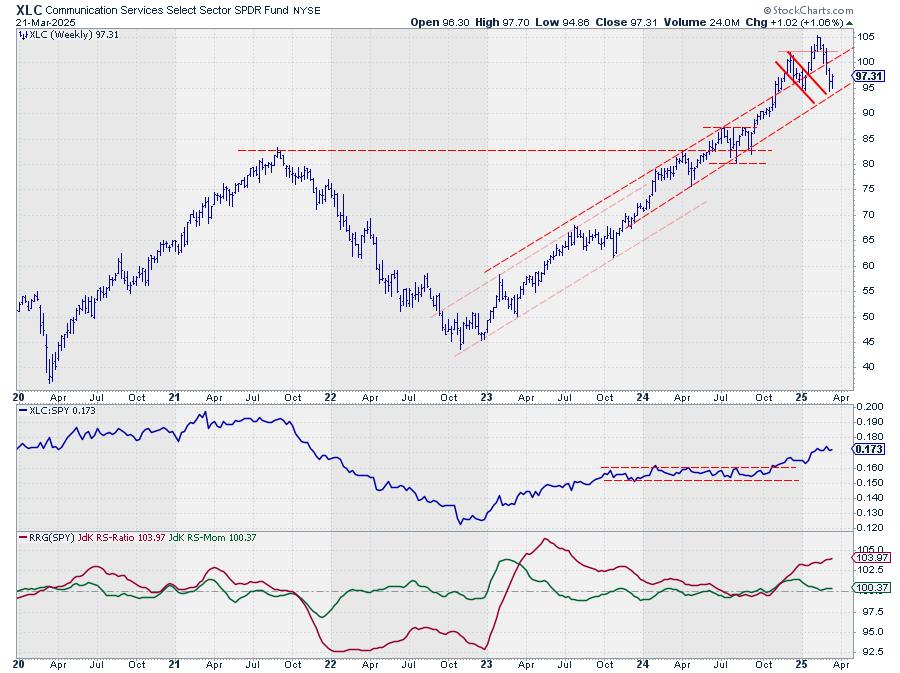
XLC held above the rising support line and closed towards the high of the week, suggesting that a new higher low is now getting into place.
Relative Strength continues to be strong, and RS-Momentum bottoms against 100-level.
Energy
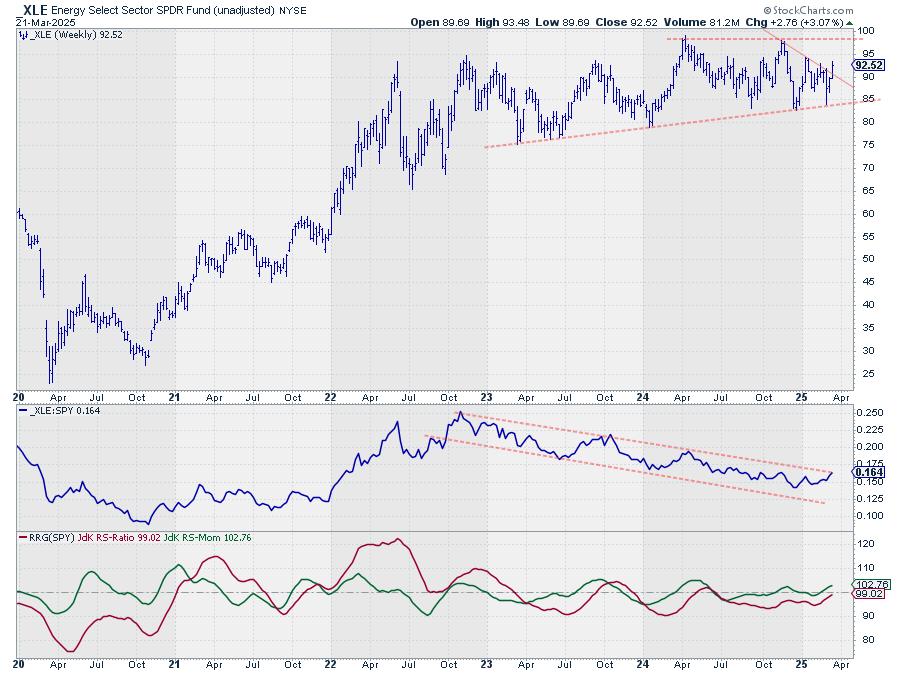
The Energy sector rapidly improved, jumping from position #6 to #2 in one week. On the price chart, XLE is breaking its falling resistance, which opens the way for a further rally to the horizontal barrier near 98.
The raw RS-line is close to leaving its two-year-old falling channel, which would signal a significant shift in sentiment and a turnaround into a relative uptrend.
Financials
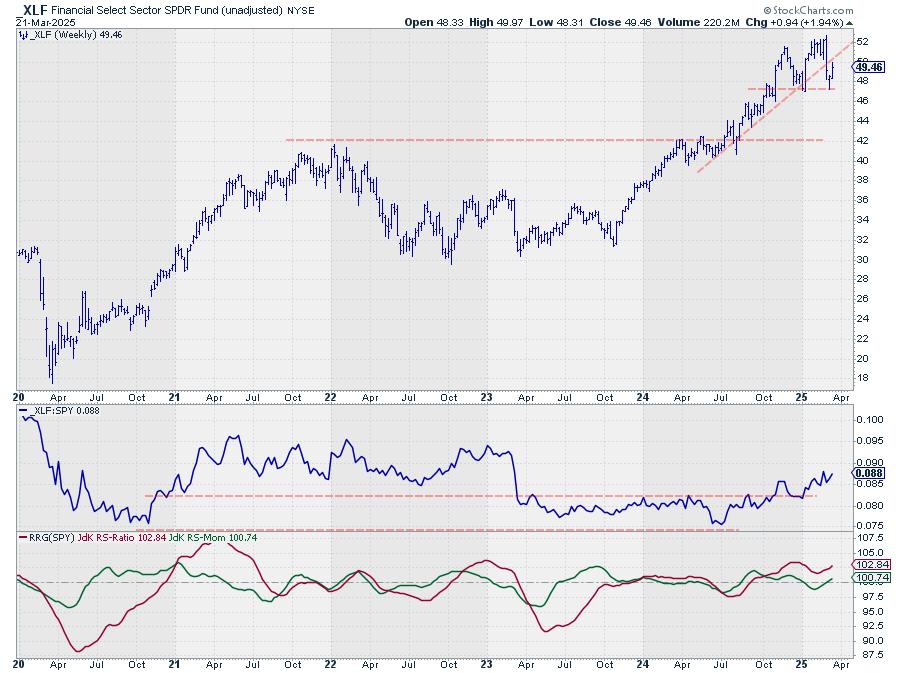
XLF remains a strong sector in position #3, with relative strength continuing to rise.
Last week's rally on the price chart brought the price back to the old rising support line, which is now expected to start acting as resistance. The former support from the low near 5o is also expected to start acting as resistance.
This means that the upside potential in terms of price seems limited for now, but RS is still going strong.
Utilities
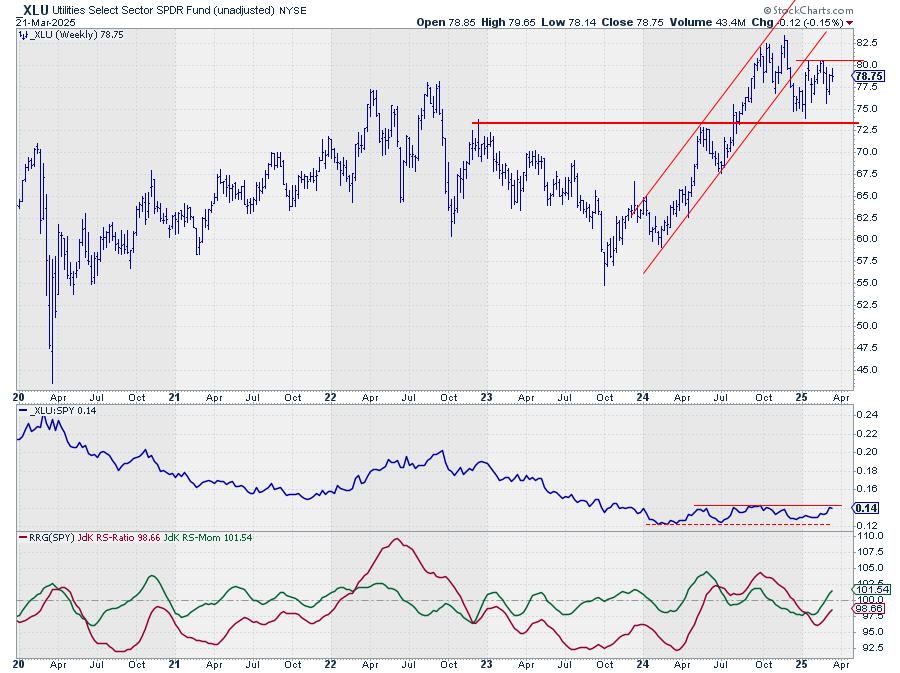
Relative strength for Utilities continues to creep higher, enough to keep the sector inside the top 5.
Both price and RS remain within the boundaries of their trading ranges.
Healthcare
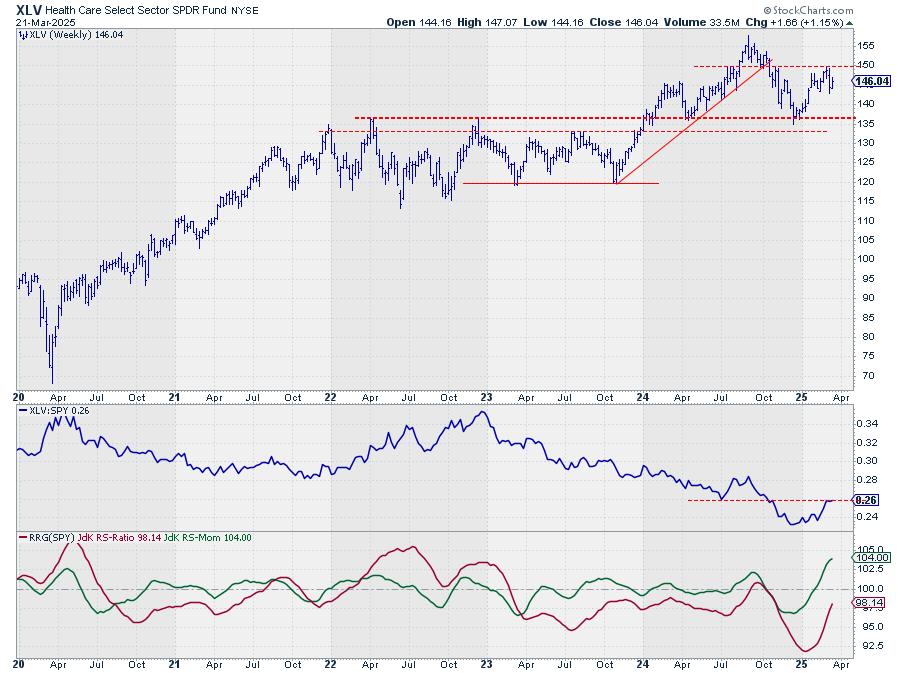
RS for the Healthcare sector stalled at the level of the previous low. The RS-Ratio and RS-Momentum combinations on the daily and weekly Relative Rotation Graphs remain strong enough to keep the sector in the top 5.
Portfolio Performance Update

In the portfolio, the position in Consumer Staples (XLP) was closed against the opening price of Monday morning (3/24). At the same time, a new position was opened in Energy (XLE) against the opening price.
The rally in Consumer Discretionary and Technology at the end of last week has put a small dent in the performance,e and RRGv1 is now 1.4% behind SPY since the start of the year.
#StayAlert, -Julius
Julius de Kempenaer
Senior Technical Analyst, StockCharts.com
Creator, Relative Rotation Graphs
Founder, RRG Research
Host of: Sector Spotlight
Please find my handles for social media channels under the Bio below.
Feedback, comments or questions are welcome at Juliusdk@stockcharts.com. I cannot promise to respond to each and every message, but I will certainly read them and, where reasonably possible, use the feedback and comments or answer questions.
To discuss RRG with me on S.C.A.N., tag me using the handle Julius_RRG.
RRG, Relative Rotation Graphs, JdK RS-Ratio, and JdK RS-Momentum are registered trademarks of RRG Research.


