
Hey Chartwatchers! Have you ever thought about how dividends may impact the price of your dividend-paying stocks or funds?
Dividends are like the cherry on the cake. They give you a little extra money for investing in a company. Not all stocks pay dividends, but for those that do, there are a few things you should know.
Unless you rely on those dividends for your everyday expenses and have opted to receive the dividends as cash payments, your dividends most likely automatically get reinvested. That means more shares for you, which is great, but you may not be aware of how much those dividends impact the price of your investment.
Generally, when a dividend is paid out, the stock price falls by that dividend amount. Because the stock price is adjusted downward, you may not notice the price change when you look at a chart of the stock.
Explore the Dividend Tools in StockCharts
When you pull up a chart, it's probably been adjusted for dividends. But maybe you're curious to find out if the dividends you receive are worth the investment. Or perhaps you're thinking of selling a dividend-paying stock and want to determine if the dividends you receive make the stock worth holding onto for a little longer. Maybe you just want to know how much the dividends you receive help your investment. It's sort of like how much better a cake tastes with the cherry on top.
To help make these decisions, consider comparing an adjusted chart with an unadjusted one.
How To View an Unadjusted Chart
This is pretty simple. All you have to do is add an underscore before the symbol and hit "enter". This will bring up an unadjusted chart. Remember, it's adjusted only for dividends; not stock splits. An unadjusted chart by itself may not reveal much, but, when you compare it against an adjusted chart, you can see how dividends impact price (see chart 1).
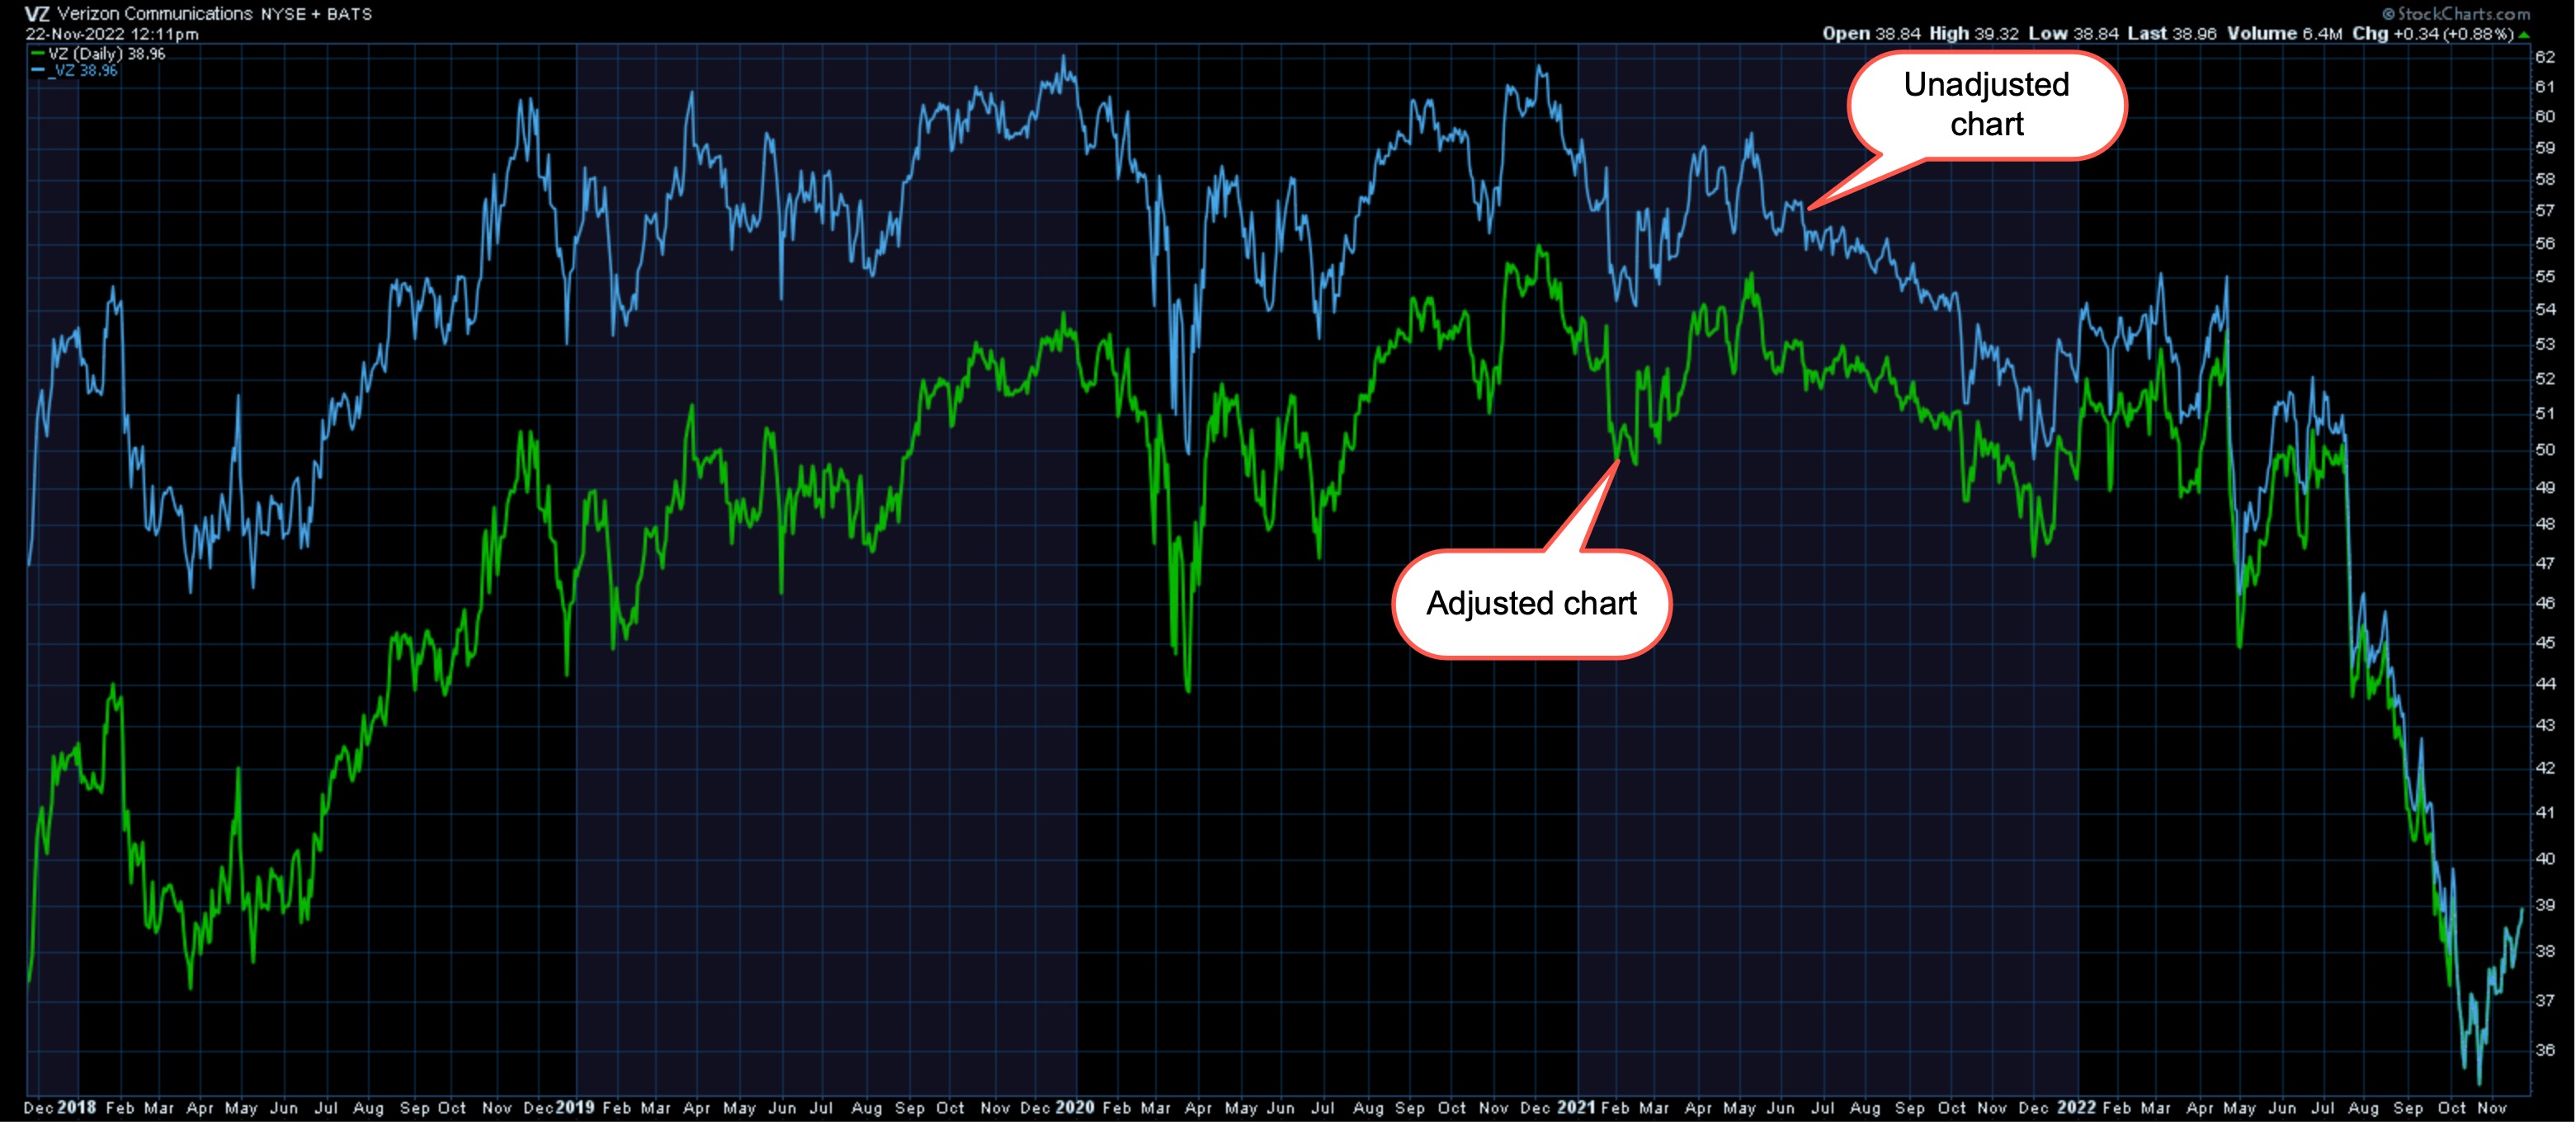 CHART 1: ADJUSTED VS. UNADJUSTED. One is not necessarily better than the other, but comparing the two gives you an idea of how dividends impact the price of the stock. Chart source: SharpCharts from StockCharts.com
Chart 1 compares an adjusted and unadjusted chart of Verizon Communications (VZ). Here's how you can bring up the chart.
- Enter VZ in the symbol box and from Chart Attributes, select Type. This chart uses a Solid Line type, which looks at pure price action. If you prefer to view the chart in terms of percent performance, select Performance from the dropdown menu.
- Select Price (same scale) from the Overlays and, in the Parameter box, enter _VZ. Click on Update and you'll see the adjusted and unadjusted charts overlaid. This allows you to compare the two. Make sure you choose to display the charts in different colors so you can easily see the difference between the two.
- Go back a few years to see the impact of dividends. The chart in this example goes back five years.
The unadjusted chart (blue line), for the most part, is at a higher price, which is expected. In the most recent quarter, the two lines are highly correlated, probably because the dividend hasn't been paid out yet.
Comparing price action or price performance of adjusted and unadjusted charts is only one piece of the puzzle. It's also helpful to know when companies pay out dividends and how much they pay out.
3 More Dividend Tools in SharpCharts
There are some other tools you could use to sharpen your dividend knowledge. For example, using the same chart of VZ, remove all indicators and overlays (see chart 2).
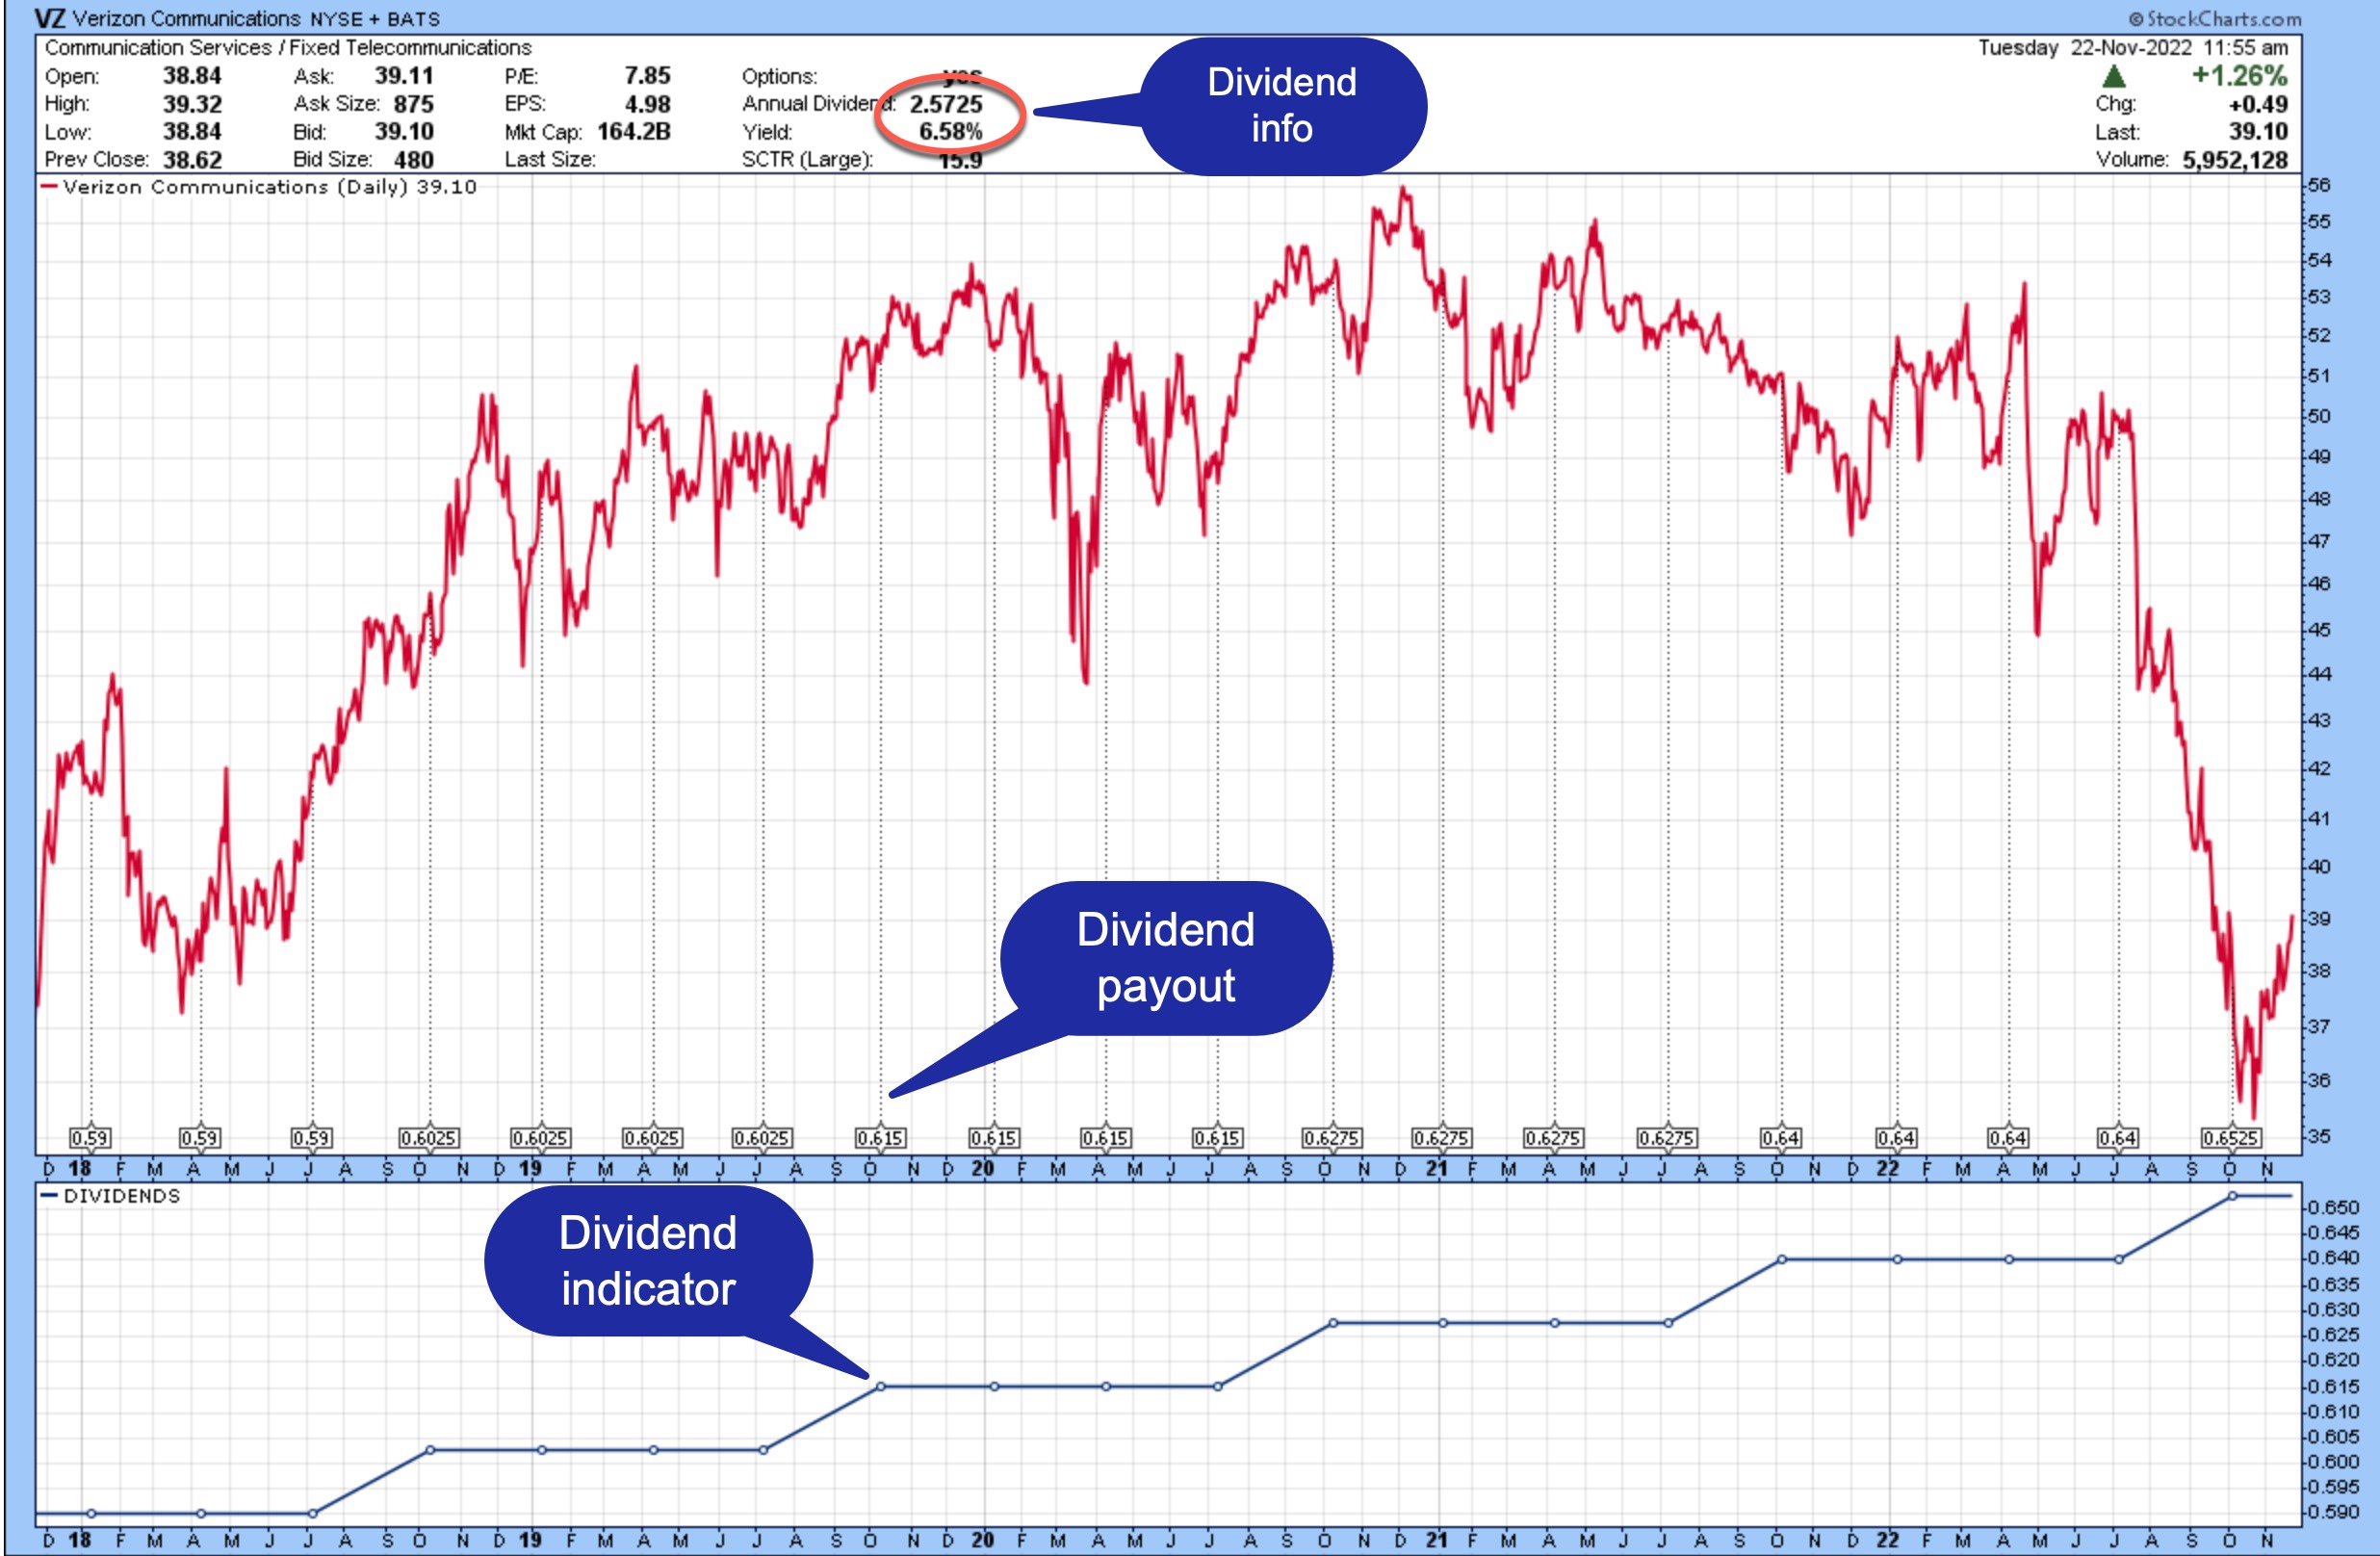 CHART 2: FULL QUOTE, EVENTS, AND DIVIDEND INDICATOR. These additional tools can provide further insight into any dividend-paying stocks or funds. Chart source: SharpCharts from StockCharts.com.
- Check the Full Quote box under Chart Attributes. This brings up the full quote area across the top of the chart. If the stock pays a dividend, you'll see the annual dividend and the dividend yield displayed. Note that these are 12-month trailing values.
- In the Overlays section, select Events from the dropdown menu and click on Update. Along the time axis, you'll see the dividend payout amounts.
- In the Indicators section, select Dividends. The dividend indicator plots dividend values over time. You can place the indicator either above or below the price chart. This allows you to line up the dividend payout and the indicator, so you can see if dividends grew and by how much.
You can compare adjusted and unadjusted dividend charts in StockChartsACP as well. Be sure to watch the StockCharts in Focus video below to explore more dividend tools.
How To Use Dividend Information

Similar to how you build bond ladders or CD ladders, you could ladder your dividends. By using the dividend tools discussed in this article, you can see when the stocks or funds you own, or are considering investing in, pay dividends. Based on the information you gathered, you could strategize investing in stocks so you receive dividends on a regular basis, such as every month or every two months. But since dividends aren't guaranteed and they vary, so you can't plan on receiving a certain amount.
If that exercise proves to be too time-consuming, you could consider mutual funds or exchange-traded funds. But remember, dividends from funds can vary even more than with stocks since the buying and selling of stocks in those funds are decided by the fund management team.
Another factor to keep in mind is that dividends are taxable. So, if you receive dividends, be sure to consult with your tax advisor.
The Bottom Line
Like the cherry on the cake, dividends can be a "nice to have" benefit, especially if you're a long-term investor. If you opt to reinvest them, you could own more shares, which in turn could potentially help increase your overall returns. If you choose to receive a dividend check, it can help bring in additional income. Either way, it helps to know how much those dividends are going to be. That's where looking at adjusted-versus-unadjusted dividend charts can help. Add in the other dividend tools, and you are in a better position to make investment decisions on those dividend-paying stocks or funds.
Explore the dividend tools in StockCharts
Jayanthi Gopalakrishnan
Director, Site Content
StockCharts.com
Disclaimer: This blog is for educational purposes only and should not be construed as financial advice. The ideas and strategies should never be used without first assessing your own personal and financial situation, or without consulting a financial professional.
Happy charting!


