
Monitoring purposes SPX: Sold long SPX on 8/14/14 at 1955.18 = gain 2.39%. Long SPY on 8/7/14 at 1909.57.
Monitoring purposes GOLD: Gold ETF GLD long at 173.59 on 9/21/11
Long Term Trend monitor purposes: Flat
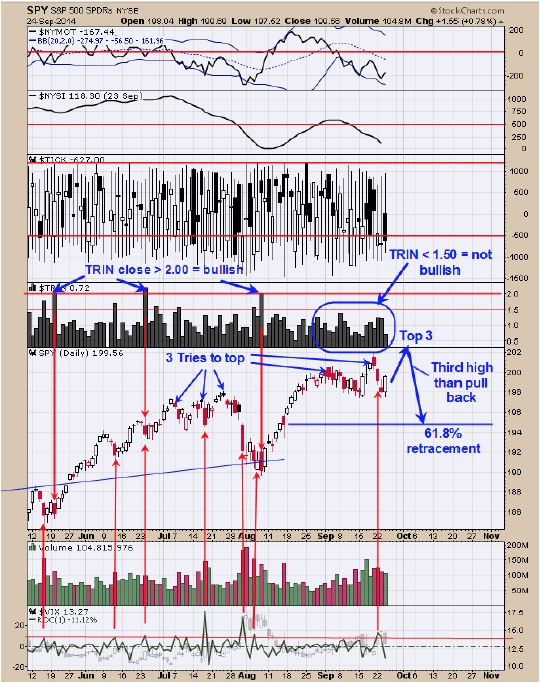
The bottom window is the Rate of Change (ROC) for the VIX. Short term lows can be found when the ROC of the VIX jumps 10% or more and Monday’s reading came in at 13.05% suggesting a low was near. The red arrows show the previous times when the VIX jumped > 10%. The bounce started a day late (today’s rally) but a bounce was expected and may rally to a third high. We have noticed in the past that a lot of the short term tops in the market came at the third try higher. The current market has two highs so far and the last two bottoms did not have a panic reading in the TRIN above 2.00 (suggesting rally will not be lasting) and it would not be out of the ordinarily for a third try for a high. If the SPY does manage a third high and the McClellan Oscillator stays below “0” and volume is light at the third high a potential sell signal could be triggered. We are not looking for a lasting decline but a test of the gap level near 196 is possible. Still neutral for now.
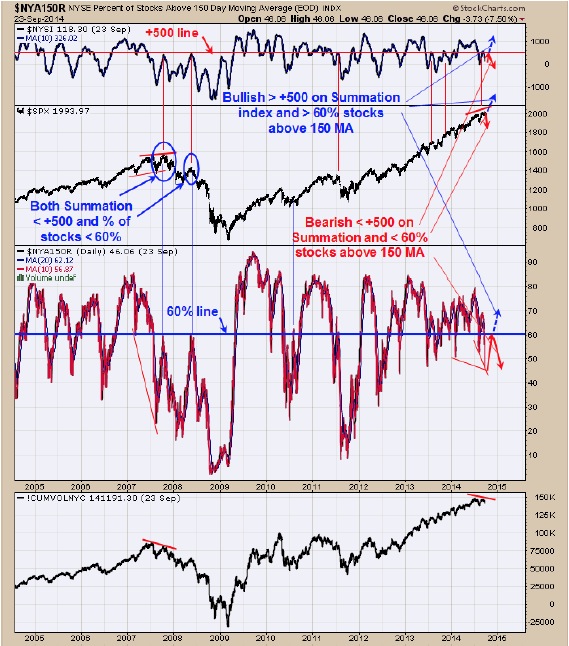
Chart above goes back in mid 2004. Top window is the McClellan Summation index. It has been a bearish sign for the market when the Summation index turns down near +500 (last top came at +586 and may be close enough). The middle window is the NYSE percent of stocks above its 150 day moving average. It has been a bearish sign for the market when this indicator turned down near 60%. It has been rare when both the Summation index turns down below +500 range and the percent of stocks in the NYSE above 150 day moving average fall below 60% near the same time but when they have it has marked major declines. On this chart this condition appeared at the 2007 top and once again in 2008. The next rally in the market is important in that both the percent of stocks below 150 day MA’s is below 60% and Summation index is below +500. The current rally needs to push the Summation index above +600 and the Percent of stocks above 150 MA to above 60% and that happens than the bullish trend in stocks most likely will continue (noted in blue). However if the Summation index stalls near +500 or below and the percent of stocks above 150 MA fails to get above 60% than market could be heading for trouble. The Feds quantitative easing program is scheduled to end in November and will take away a lot of liquidity. We will be watching how the next rally unfolds.
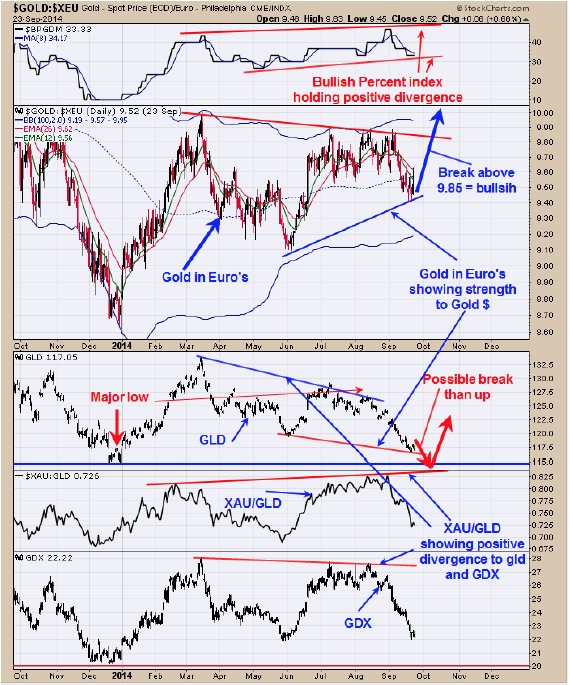
The short term momentum is still down both for gold and gold stocks. However the next low for gold and gold stocks may be a lasting bottom. There are intermediate term positive divergences showing up. The Bullish Percent index (top window) made a higher high in August where Gold and GDX made lower highs showing positive divergence. It’s a bullish sign for Gold and gold stocks when gold stocks are outperforming gold. The XAU/GLD ratio is making higher highs and higher lows where Gold is making lower highs and lower lows and shows that XAU is outperform gold. It’s also a bullish sign for gold when Gold/XEU is outperforming Gold/Dollar and on the chart above you can see that positive relationship (in blue lettering). A bullish triggered for the end of the decline in gold and gold stocks would be for the Gold/XEU to break above the trend line near 9.85. There is also a possible capitulation setup in the making where Gold (GLD) breaks the last major low in December 2013. This break down could trigger bullish signals if GLD closes back above the December 2013 low and Gold/XEU closes above 9.85.
Tim Ord,
Editor