
Western Candlestick Patterns
Retail technical traders often struggle with determining when and how to enter a stock, how long to hold the stock, how to determine the gain potential, and when and how to exit a stock.
Many times technical traders who have only learned basic Japanese candlestick patterns or basic technical patterns, miss good entry patterns or do not recognize Western Candlestick Entry Signals. An entry signal is not necessarily one candle or even 3 candles, it often times will be a group of candles. What happened before the pattern is just as important as the entry signal.
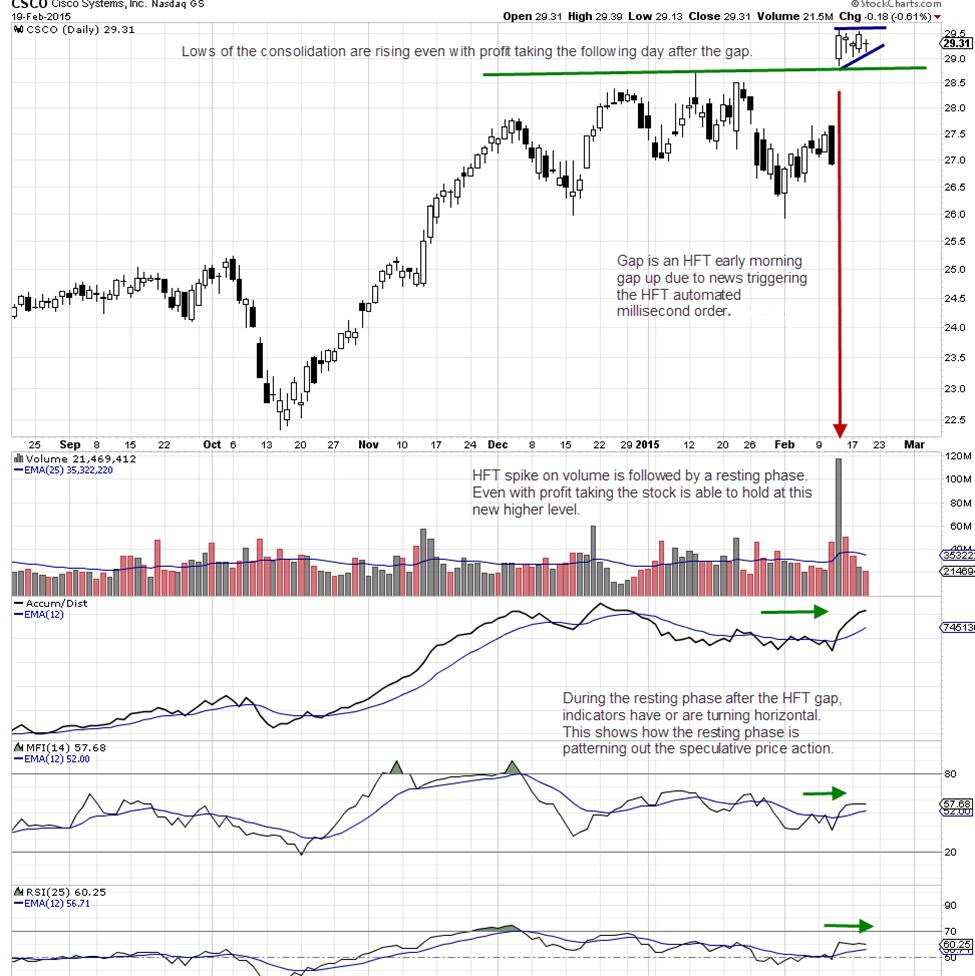
As in the case of Cisco Systems, Inc. (NASDAQ: CSCO) the gap occurred to the upside, while an engulfing black the day before the gap implied a downside signal. This is why Japanese candlesticks by themselves are no longer viable. It is imperative that retail technical traders today incorporate Western Candlestick Patterns along with indicators that track large lot activity. CSCO engulfing black was not an ideal sell short. It should have been obvious it was not based on the analysis of the candles that preceded that engulfing black, which occurred because retail technical traders assumed incorrectly that CSCO was going to move down rather than up. See the chart example below.
When a retail technical trader can read the Western Candlestick Patterns, it becomes obvious just by looking at the prior candlesticks that large lot buyers were in control of price.
Entering a stock at the optimal time for the trading style requires excellent Spatial Pattern Recognition Skills™ and the ability to use Western Candlestick Entry Patterns, and in addition the ability to identify whether smaller lots or large lots are controlling price.
When Swing trading or Day trading even a minor mistake on the entry can result in a small loss, bad fill, or lower point gain in profits. The entry must be made so that the highest potential profit with the lowest risk are present at the time of entry, rather than trying to “buy on a dip” which often ends up with the retail technical trader on the wrong side of a retracement or correction.
Buying into strength means that the entry is made as the stock continues to show improving price action BEFORE price runs. Buying into strength rather than buying into weakness using a basic limit order, is how professional traders enter stocks in the modern automated market where High Frequency Traders HFTs can create huge whipsaw action without warning.
Entries should be planned well in advance of price actually moving. The most reliable patterns are when Dark Pools or professional traders are buying the stock, but in doing so are controlling price so that the candles are small and tightly compacted. A compression also shows price is controlled, or as in the case of CSCO the lows of each day are rising indicating that buyers are entering each day at a slightly higher price.
When a stock gaps and then forms a compression or a consolidation with tightly controlled price action, this is an indication that the buyers are using larger lots than the sellers. Controlled price of this type is based on a bracketed professional order. Often indicators both Price and Volume based will turn horizontal rather than retrace. This is a confirmation that the buyers are larger lots even while Volume may appear below its average.
To insure a good fill, retail technical traders should use a controlled bracketed order similar to what professionals use. This provides two types of protection. First from whipsaw action should HFTs trigger to the downside on a false negative news algorithm, which is a common mistake for many HFT algos. Secondly, to insure that the entry is made as the stock is moving up.
Summary:
When retail technical traders trade with the giant and large lot traders and enter while the stock is resting while patterning out the HFT speculation, it lowers the risk while increasing the potential for higher profits. Point Gain Potential for the run should be used to determine the expected average run gain, and the risk versus profit analysis should be at least 3/1 or 4/1 for Swing traders.
Trade Wisely,
Martha Stokes CMT
www.TechniTrader.com
info@technitrader.com