Market Participants And Price Action
Before High Frequency Traders HFTs, Dark Pools, Twilight Pools, and an 80% automated marketplace price was the most important indicator. Many technical traders learned simply to rely upon price action and rarely considered volume or quantity analysis.
Nowadays, with the dramatic changes to the trading world volume and quantity must be analyzed along with price. This fact challenges older strategies, however the reality is that the most dominant Market Participant Group in the market now has even more complex orders which gives that group the ability to buy giant share lots without disturbing price.
The only aspect of data that reveals where the giant lots are, is volume and quantity.
A giant lot is 100,000 - 500,000 shares. The giant lot buyers do not want to disturb price or the trend of the stock, as they purchase millions of shares over time. The SEC doesn’t want these giant lots to disturb price either. That is why Dark Pools are here to stay. The Alternative Trading System ATS venues of which there are currently approximately 40 plus or minus, are where 99% of the giant lot orders are processed. These are OTC orders using controlled bracketed TWAP and other time and price based orders that trigger automatically, but are NOT high frequency or low latency orders.
The reason the giant lots are so important for technical traders to find early on, is that these huge lots are removing liquidity which in turn will eventually create an imbalance in supply and demand for the shares of stock. When supply diminishes and demand rises, prices can suddenly move up as HFTs, professional traders, and authorized participants discover the quiet accumulation by the giant lot investors.
Volume is the total number of shares traded or exchanging hands during a set period. The chart below is a daily chart so the volume shown is the total number of shares for an entire day. This includes the volume data from ATS, ECNs, and other off-exchange venues. There are two sides to each trade a buyer and a seller, but only ONE quantity which translates into volume of shares.
Quantity reveals the size of the lot which is critical to identifying Dark Pools, professional traders, and HFTs as opposed to individual investors, smaller funds, or retail traders.
See the chart example of Johnson & Johnson (NYSE: JNJ) with a daily chart view below. The indicator Volume is in the bottom chart window.
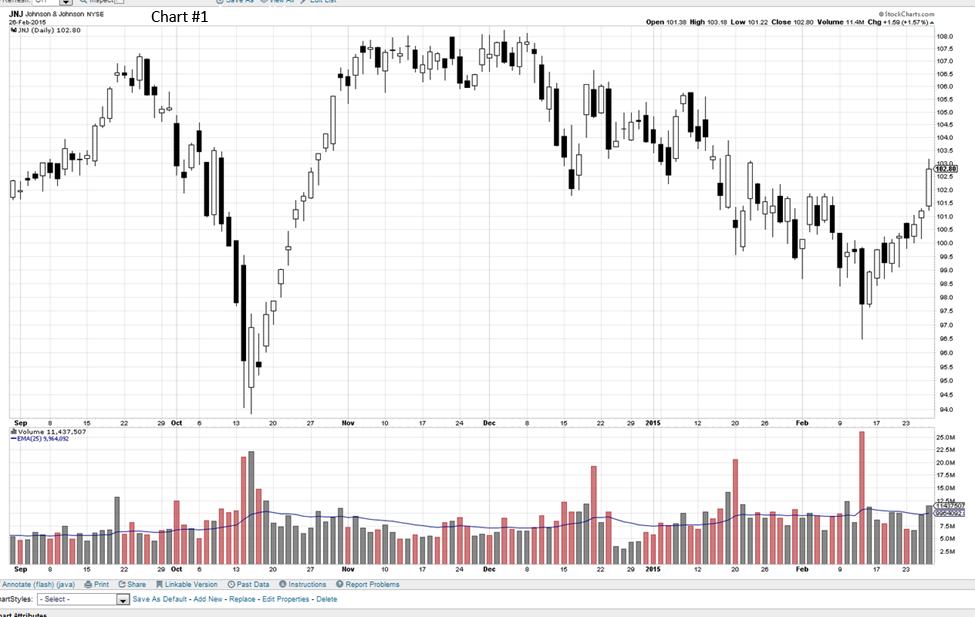
Huge volume spikes are predominantly the effect of HFT millisecond transactions firing off at 60,000 to 90,000 per minute. There will always also be smaller lot investors, retail, and some smaller funds involved in these huge volume surges. However there will rarely be Dark Pools as those orders avoid or cease triggering when volume surges, or when price rises speculatively.
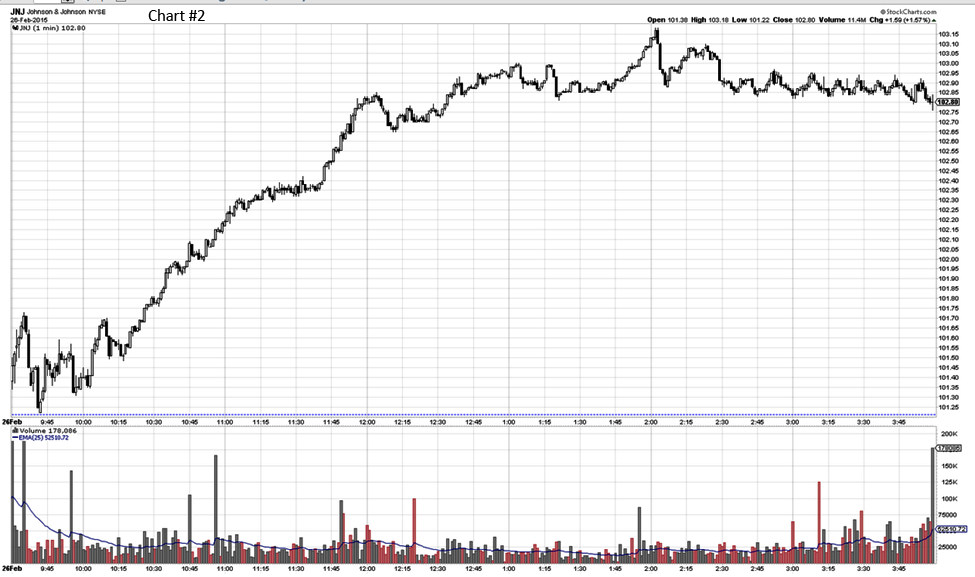
The chart example below is the identical stock chart of JNJ as above, but with an intraday view.