
Monitoring purposes SPX: Short SPX on 4/7/15 at 2076.33.
Monitoring purposes GOLD: Short GDX on 4/7/15 at 19.22; stop 21.26.
Long Term Trend monitor purposes: Flat
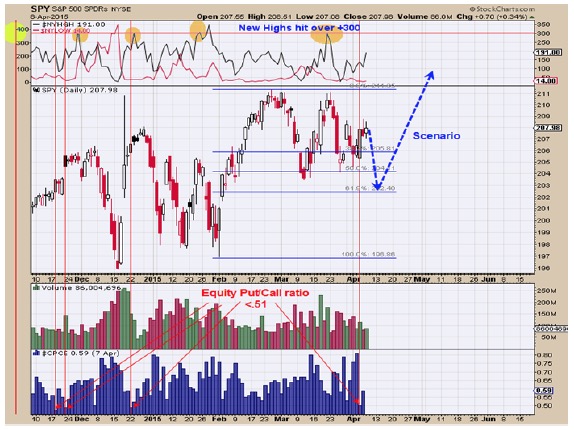
On Monday the Equity put/call ratio closed at .50 (twice as many calls as puts). When this ratio gets this low it usually indicates short term exhaustion. The last three times this ratio got his low came near short term tops (see chart above). We are still expecting a minor pull back to the 203 – 202 range before the market heads higher. If we have the potential pull back right, than the TRIN, TICK and VIX should reach extremes and add fuel to the next rally, of which we are expecting it to hit new highs. For the mean time we will stay with our short SPX position.
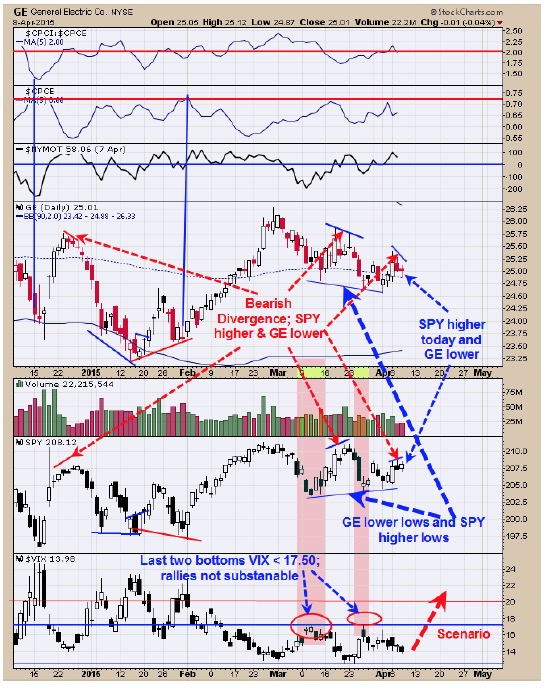
It is said, “Where GE goes so goes the market”. Today SPY rallied and GE was down and a short term negative divergence for the SPY. Since the March low in the SPY, it has been making higher lows and GE has made lower lows and suggests SPY at some point will break the March low. The bottom window is the VIX. Most worthwhile lows in the market formed when the VIX was greater than 22. Since the mid March low in the SPY, the highest VIX reading was only 17.50 range and not showing a lot of fear. To get an extended rally going there should be plenty of Fear and the VIX helps to gauge fear. The higher the VIX reading, in general the more fear in the market. The recent VIX reading near 17.50 is not enough to get a new up-leg going in the market. We are expecting one more pull back (possible down near 203 – 202 range) to push the VIX higher than 22. From there we would expect an impulse rally to begin. Short SPX on 4/7/15 at 2076.33.
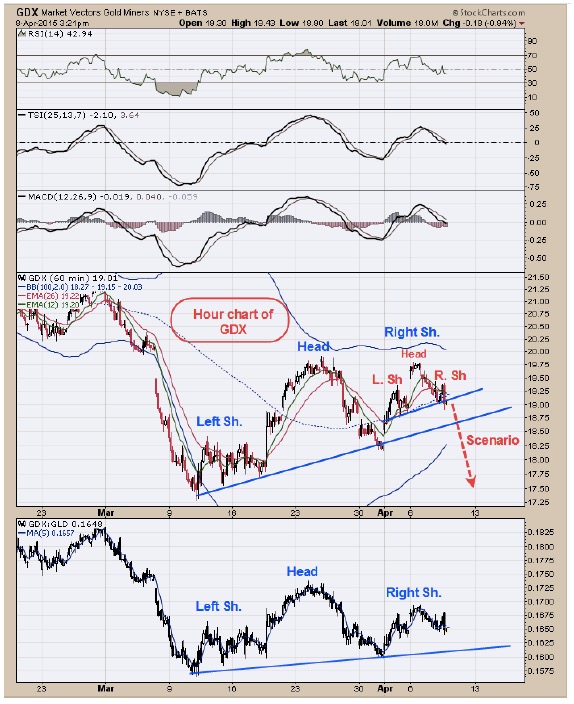
Above is the hour chart of GDX going back about a month and a half. What appears to be showing in issuant is the Right Shoulder of a larger Head and Shoulder pattern (where the Head is the January high) and this Right Shoulder also appears to be drawing a Head and Shoulders top (Where the Head is the March 25 high). You might notice that the “Right Shoulder” of is hourly “Head and Shoulders top pattern” also appears to be drawing a “Head and Shoulders top”. The larger Head and Shoulders top where the Head is the January high has a measured target near 13 on GDX. There is major resistance near 20.21 and a break above that level with a “Sign of Strength” would negative this “Head and Shoulders top pattern” and the reason we have our stop at 20.26. The GDX/GLD ratio appears to be drawing the same pattern. Short GDX at 19.22 on 4/7/15; stop at 20.26.
For examples in how "Ord-Volume" works, visit www.ord-oracle.com.
Tim Ord,
Editor