
Monitoring purposes SPX: Flat.
Monitoring purposes GOLD: Short GDX on 4/22/15 at 19.40; stop 20.26.
Long Term Trend monitor purposes: Flat
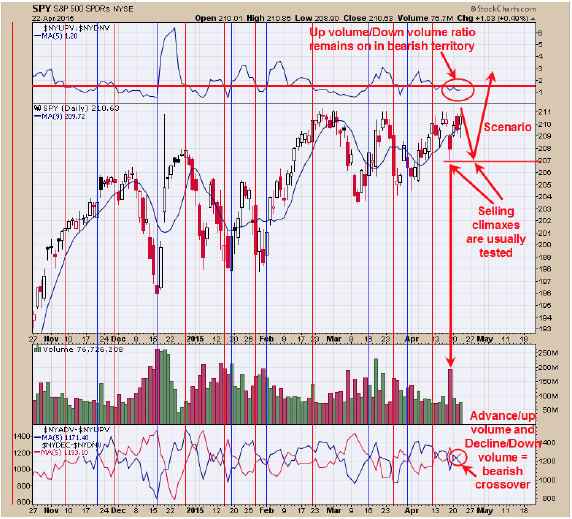
Chart 1
Timers Digest recorded the Ord Oracle #6 in performance for 3 months updated March 9, 2015.
Even though the market rallied today the internals did not show a lot of strength. The top window is the NYSE up volume/NYSE down volume with 5 period MA. Readings below 1.50 are a bearish sign and today’s close was 1.20. Bottom window is the advance-up volume with 5 period MA and Declining-down volume with 5 period MA. This chart remains on a bearish crossover. Last Friday a “Selling Climax” occurred near 207 on the SPY and most are tested at some point before the market move much higher and we are expecting that to occur here. The bigger trend is up but a short term pull back to test last Friday’s low near 207 is possible.
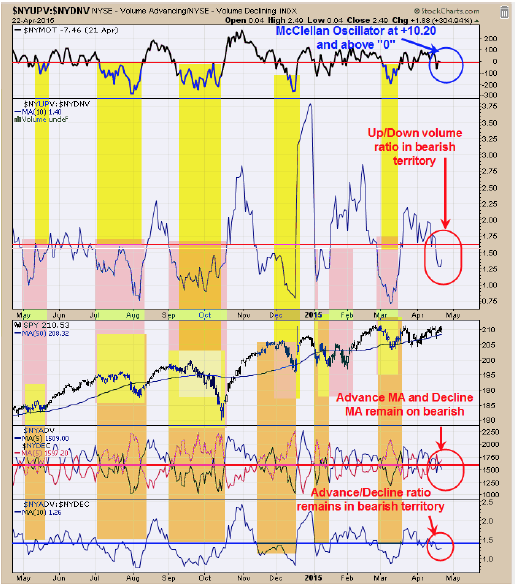
Chart 2
The above chart helps to define the Health of the market. The top window is the McClellan Oscillator which closed today at +10.20 and modestly bullish. Next window down is the NYSE up volume/NYSE down volume with 10 period moving average. Readings below 1.65 are bearish and today’s reading came in at 1.40. Bottom window is the NYSE advance/NYSE decline with 10 period moving average. Readings below 1.45 are bearish and today’s reading came in at 1.26. Next window up is the NYSE advance with 5 period moving average and NYSE decline with 5 period moving average and this chart remains on a bearish crossover. Of the four indicators on this page; three are on bearish readings.
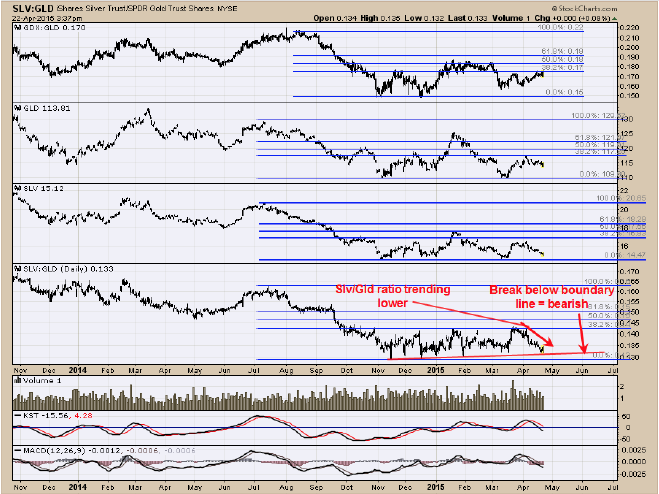
Chart 3
The “line in the Sand” is the horizontal at 20.21 which is the December 2013 low and the November 2014 high. Right now GDX is below that line and showed weakness today. A rally above 20.21 with a “Sign of Strength” would change the trend back to bullish. The fourth window down from the top in the above chart is the SLV/GLD ratio. It a bullish sign for gold and gold stocks when SLV is outperforming GLD and is what happens when this ratios is rising. And when SLV is underperforming GLD than that is a bearish sign for gold and Gold stocks and the ratio is falling. Since late March this ratio has been steadily falling and a bearish sign for both gold and gold stocks. A break below the red boundary line draw on this ratio would suggest a speed up in the decline of this ratio and add to the bearish short term view of both gold and gold stocks. Short on 4/22/15; GDX at 19.40; stop at 20.26.
-Tim Ord
Editor
For examples in how "Ord-Volume" works, visit www.ord-oracle.com.