
Monitoring purposes SPX: Sold on 10/5/15 at 1987.05; gain 2.28%. long SPX on 9/22/15 at 1942.74.
Monitoring purposes GOLD: Flat
Long Term Trend monitor purposes: Flat
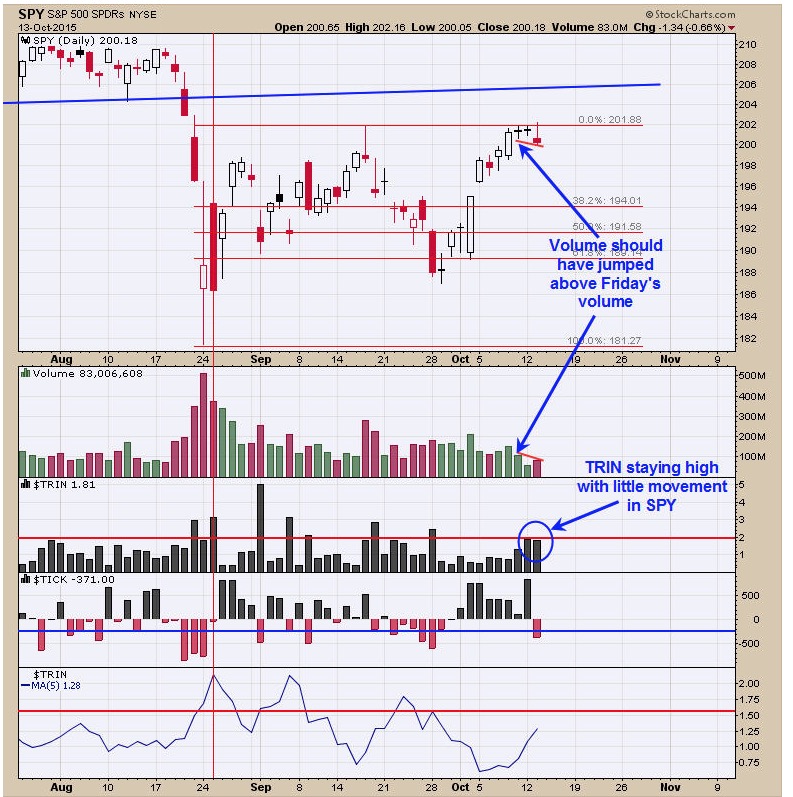
The SPY pulled back today and closed below the last two lows. Today’s modest break below the last two lows should have seen volume to at least equal the highest volume of the last two days to confirm. That did not happen here as today’s volume was lighter by over 10% compared to Friday’s volume and that suggests today’s break lower could turn into a false break and reverse back up. Though the market has not moved much the last three days the TRIN has. The average TRIN for the last three days is 1.65 and a reading that is associated with a market that is near a low rather than a high. Market could still push higher short term and possible get to the next resistance up which is near the 205 range on the SPY. We don’t have all the evidence we like to put a trade on here but the next couple of days could give us that evidence. We are staying neural for now.
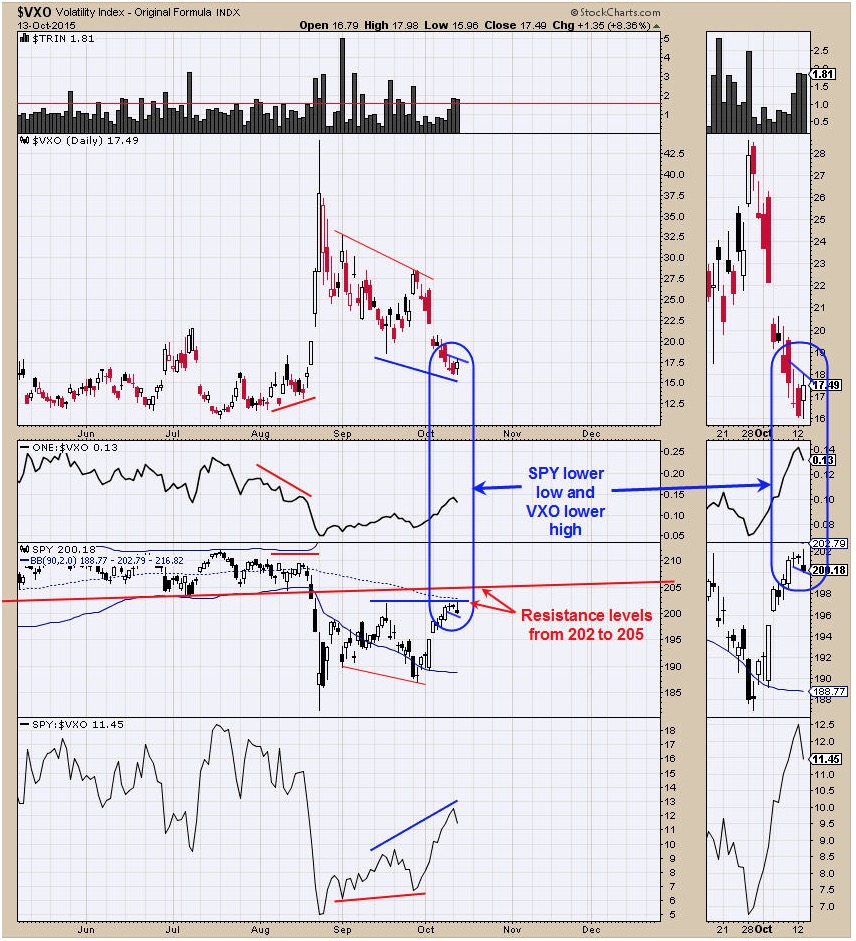
Today the SPY broke to a new three day low where the VXO made a lower high in the last three days. This condition is not confirming the possibility that the SPY decline will continue. There is not a lot to go on here but with the Volume and VXO not supporting the idea for lower prices short term, we will just set on our hands. If another high TRIN close comes in tomorrow (> 1.50) along with another narrow range day in the SPY, a bullish signal could get triggered. Next upside resistance is near the 205 range on the SPY. Sold long SPX on 10/5/15 at 1987.05 = gain of 2.28%; Long SPX on the close of 9/22/15 at 1942.74.
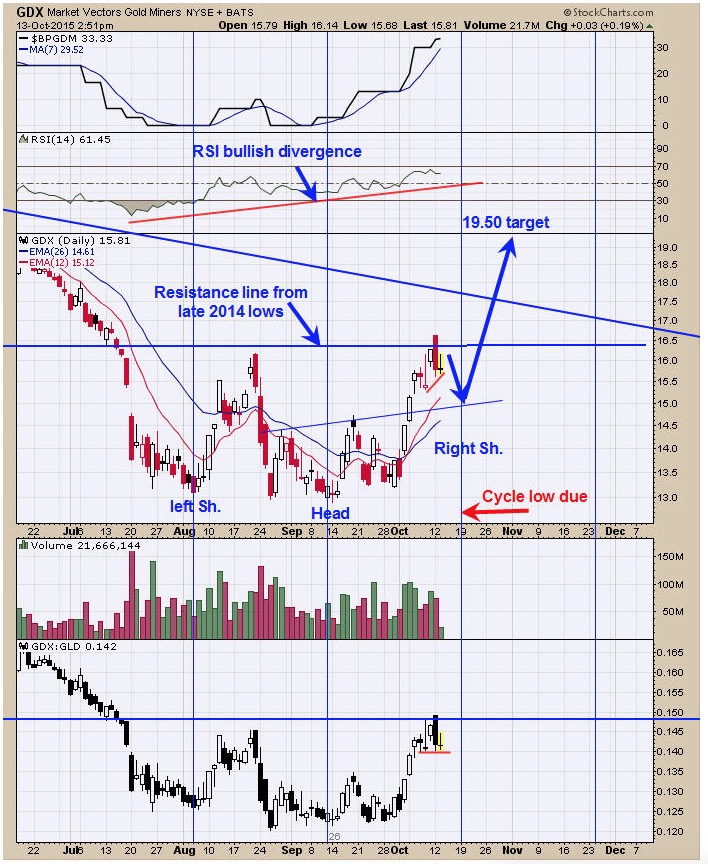
The potential Head and Shoulders bottom pattern is playing out. An ideal time for a short term pull back is now. Yesterday GDX ran into the resistance area near 16.50 and backed away suggesting that area has resistance. We have a minor cycle low due 10/19 and support in the 15 to 14 range and could represent the Right Shoulder low for the potential developing Head and Shoulders bottom on GDX. This developing Head and Shoulders bottom has a measured target near 19.50. The GDX/GLD ratio is showing a divergence short term and helps the idea for a pull back to continue. The RSI is showing a bullish divergence on a larger time frame and keeps the larger trend looking bullish. It is appearing the low hit on September 11 may have been the bottom. We are looking for a bullish setup in the 15 to 14 range on GDX due later this week to early next week.
Tim Ord,
Editor
For examples in how "Ord-Volume" works, visit www.ord-oracle.com.
New Book release "The Secret Science of Price and Volume" by Timothy Ord, buy on www.Amazon.com.