
Monitoring purposes SPX: long SPX on 11/2/15 at 2104.05
Monitoring purposes GOLD: Flat
Long Term Trend monitor purposes: Flat
The chart below the SPY chart is the 15 day average of the SPY/TRIN ratio. When this ratio is below the lower boundary line, it’s a bullish sign for the market. As you can see its still below the lower boundary line even after the market has rallied over the last week. When the SPY/TRIN ratio starts testing the upper boundary line will suggests a high is near. The bottom window is the McClellan Oscillator. In general when the McClellan Oscillator is above “0” than the market is considered in an uptrend and today’s close came in at +109.03 and up form yesterday’s reading of 105 Range. Support comes in near 2050 on the SPX. Another interesting statistics; when October up > 5% (up over 8%) and up year to date than November has never been down (going back to 1950). Long SPX on 11/2/15 at 2104.05.
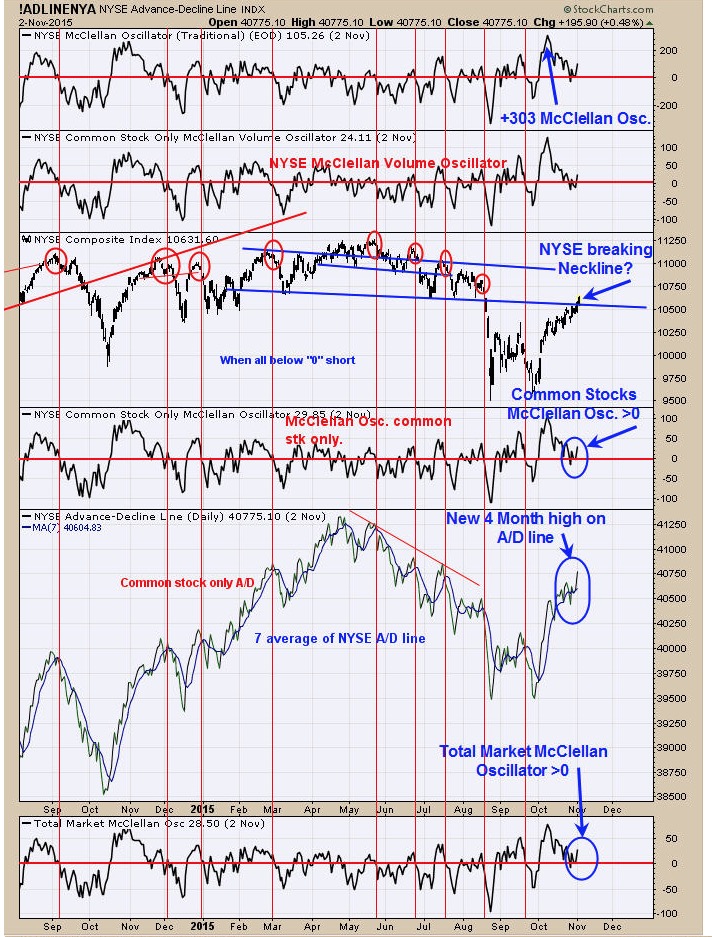
Back on October 8, the McClellan Oscillator reached +303 and suggested a breadth thrust and a bullish sign for the market. The chart above helps to define the trend of the market and right now its showing bullish signs. The top window is the McClellan Oscillator and readings above “0” suggests the market is in an uptrend and today close came in at +117. Next window down is the Common stocks only McClellan Oscillator and this Oscillator is also above “0” and bullish. Next chart down is the NYSE. It appears the NYSE is attempting to break through Neckline resistance and opening the door for much higher prices. Next window down is the NYSE Advance/Decline line and it has just broken to a four month high. Bottom window is the Total Market McClellan Oscillator and it too is above “0” and bullish. Trend is up and may stay up into yearend. Long SPX on the close of 11/2/15 at 2104.05.
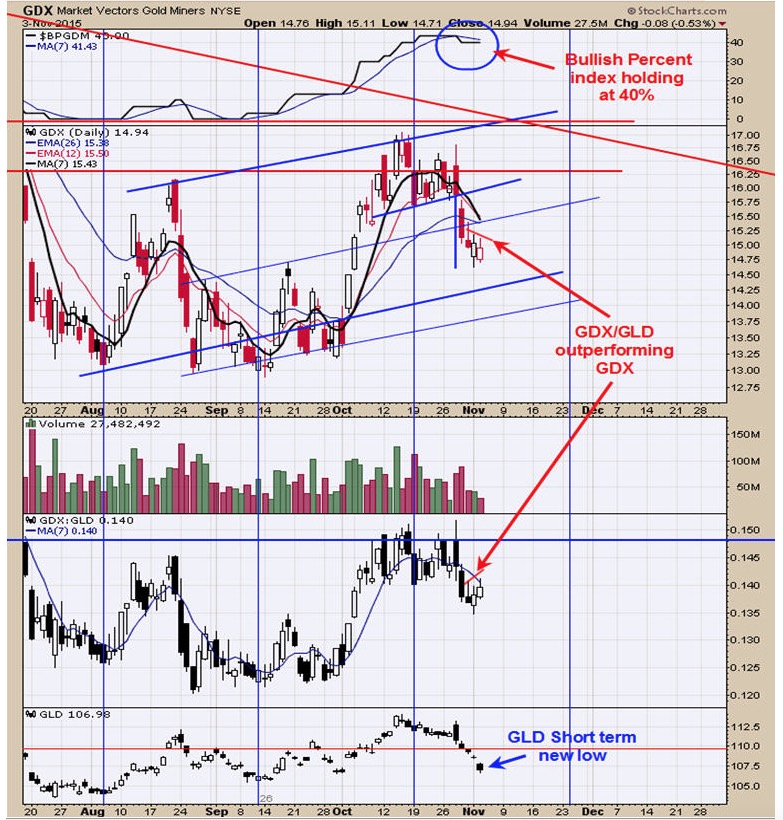
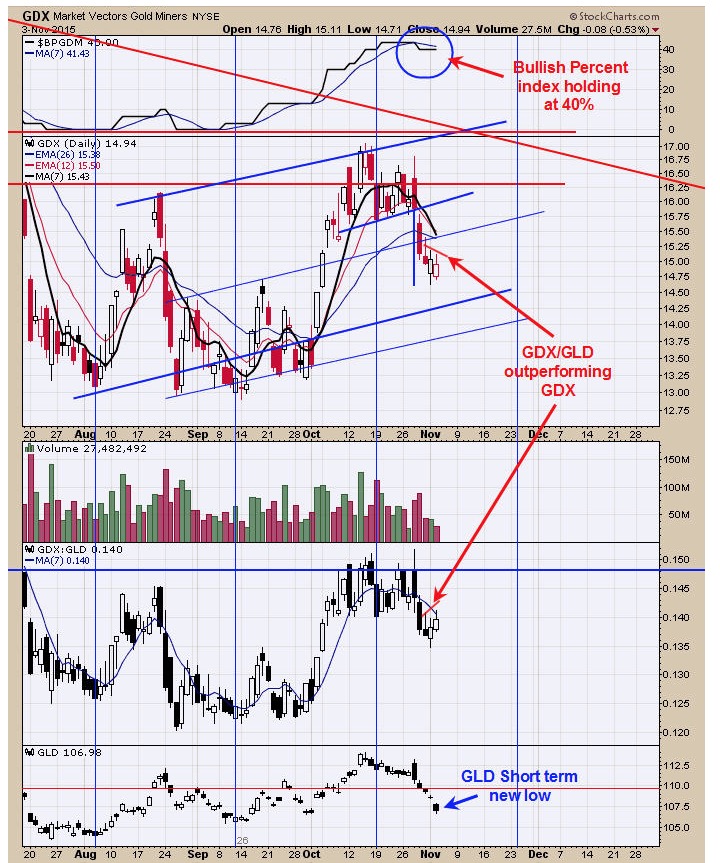
An interesting development occurred today between GDX and GDX/GLD ratio. Today GLD broke and closed at a new short term low where GDX did not touch a new short term low and closed just a bit down. In bullish market for gold and gold stocks, Gold stocks outperform gold and that is what happen today. One day doesn’t make a trend but is something to watch going forward. GDX/GLD made a higher high where GDX made a lower high showing that GDX/GLD ratio is outperforming GDX which in turns shows that GDX is outperforming GLD. Gold’s open interest and short interest are in bearish levels but if GDX holds steady if not rally while GLD relatively remains weak will suggests a bull market is beginning in the gold stocks. Still neutral for now.
For examples in how "Ord-Volume" works, visit www.ord-oracle.com. New Book release "The Secret Science of Price and Volume" by Timothy Ord, buy on www.Amazon.com
Tim Ord,
Editor