
Monitoring purposes SPX: Sold long on 3/1/16 at 1978.35 = gain 3.12%: Long SPX on 2/19/16 at 1917.78.
Monitoring purposes GOLD: Short GDX on 2/24/16 at 19.11.
Long Term Trend monitor purposes: Short SPX on 1/13/16 at 1890.28
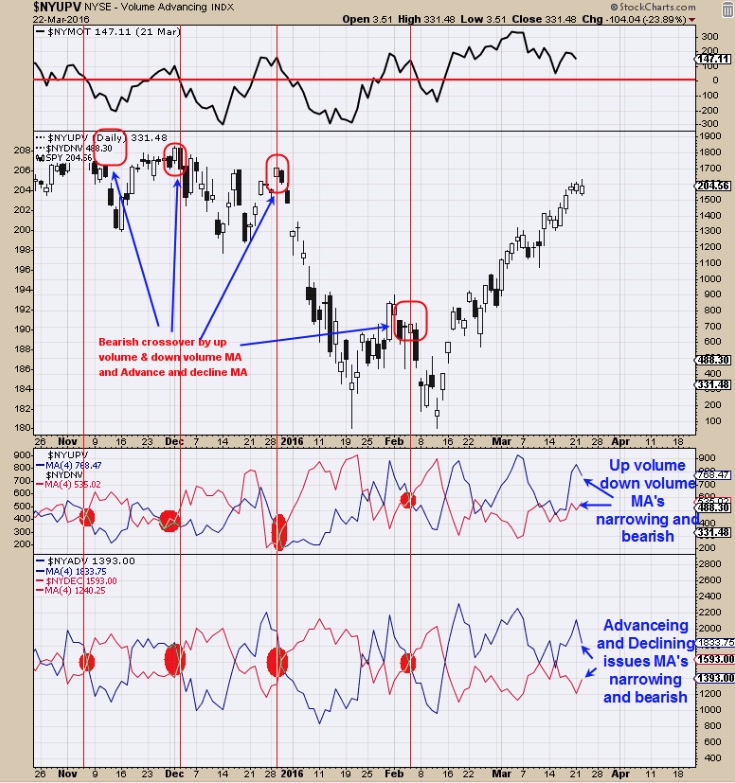
The above chart is a momentum chart for the up and down volume along with up and down stocks for the NYSE and helps to gauge the strength or weakness in the market for short term. When both of these indicators have a bearish crossover, than a bearish signal is triggered, (noted with red verticals lines). The bottom window is the NYSE Advancing issues with 4 period moving average and NYSE Declining Issues with 4 period moving average which is on a bullish crossover but has shown narrowing today and a bearish sign. Next window up is the NYSE up volume with 4 period moving average and NYSE down volume with 4 period moving average and this indicator also remains on a bullish crossover but has narrowed today and a bearish sign. Friday the market is closed (good Friday) and market may hold steadying going into the holiday. Sold long SPX on 3/1/16 for gain of 3.12%.
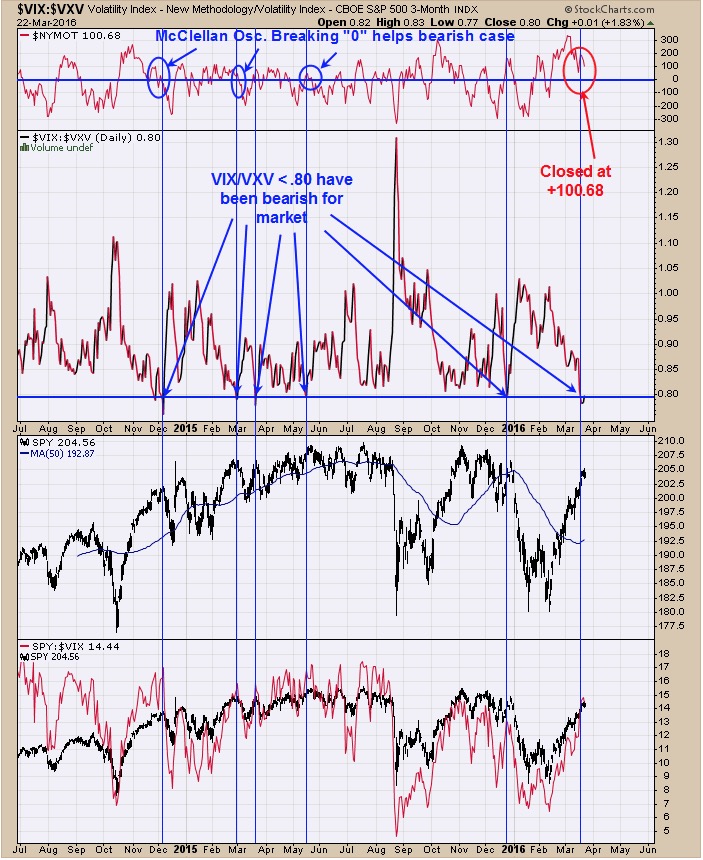
The middle window is the VIX/VXV ratio. VIX is the VIX and the VXV is the CBOE S&P VIX. This ratio has done a good job in helping to find short term tops in the SPY. Readings below .80 have lead to short term tops in the SPY and today’s close came in at .80 up form yesterday’s lower low. To help confirm a short term top is the top window in this chart which is the McClellan Oscillator. A more reliable top can form when the VIX/VXV ratio falls below .80 and the McClellan Oscillator breaks below the “0” line. The McClellan Oscillator closed at +100.68 today. There is two more trading days this week and the McClellan Oscillator still could break the “0” line before the week is out. Previous examples of this type of sell signal lead to a week or two of decline and that is what we would expect here if a sell signal is triggered.
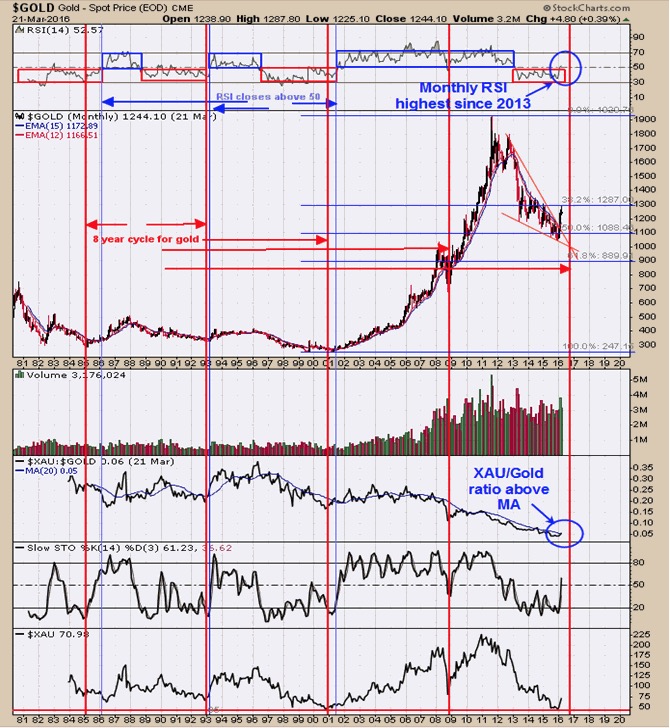
The Gold Commercials came in at – 185,531contracts as of 3/18/16; previous week reading was minus 195,372 contracts. Above is the monthly Gold chart going back to late 1980. The Red verticals show the Eight year cycle for gold and the next one comes in September 2016. These eight year cycles can come early or late by several months and the low in December 2015 may have marked the major low. The top window is the monthly RSI for Gold. In bull markets the RSI in general trades in the 50 to 70 range (boxed in blue) and in bear markets the RSI trades 30 to 50 range (boxed in red). As you can see the RSI appears to be breaking out above 50 (current reading is 52.57) and hasn’t been that high since 2013. Since this chart is on the monthly time frame, we will have to wait tell month end to see if the RSI can stay above 50 which would suggests a bull market has started by this method. Short term the market is extended and a pull back is possible, but the longer term trend appears to be or has turning up.
We are short GDX at 19.11 on 2/24/16.
Tim Ord,
Editor
For examples in how "Ord-Volume" works, visit www.ord-oracle.com. New Book release "The Secret Science of Price and Volume" by Timothy Ord, buy on www.Amazon.com.