
Monitoring purposes SPX: neutral.
Monitoring purposes GOLD: Neutral
Long Term Trend monitor purposes: Short SPX on 1/13/16 at 1890.28
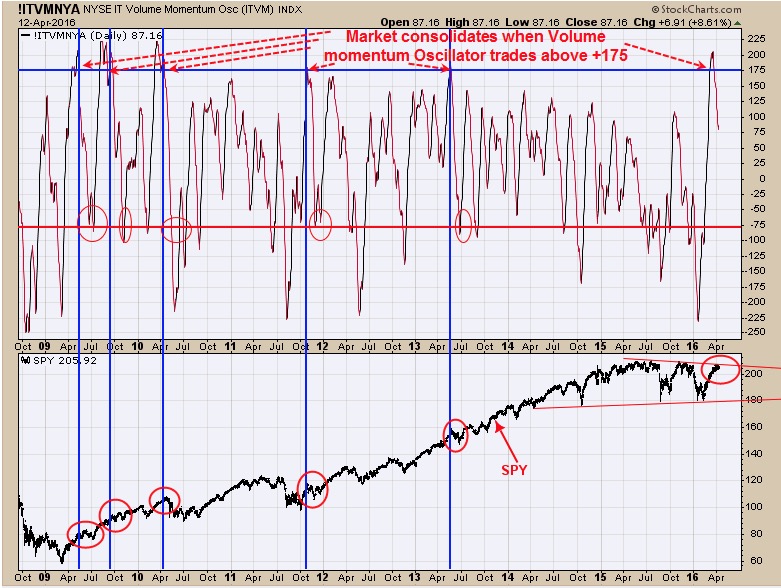
Above chart is the Volume Momentum Oscillator for the NYSE. This chart goes back in mid 2008. Short term consolidation have occurred when the Volume Momentum Oscillator reached +175 or higher. It has reached this level six time (counting this time) and the previous five times the market stalled. Therefore will be looking for evidence for a short term top once the SPY hits a new high (at least we think the market will touch a new high).
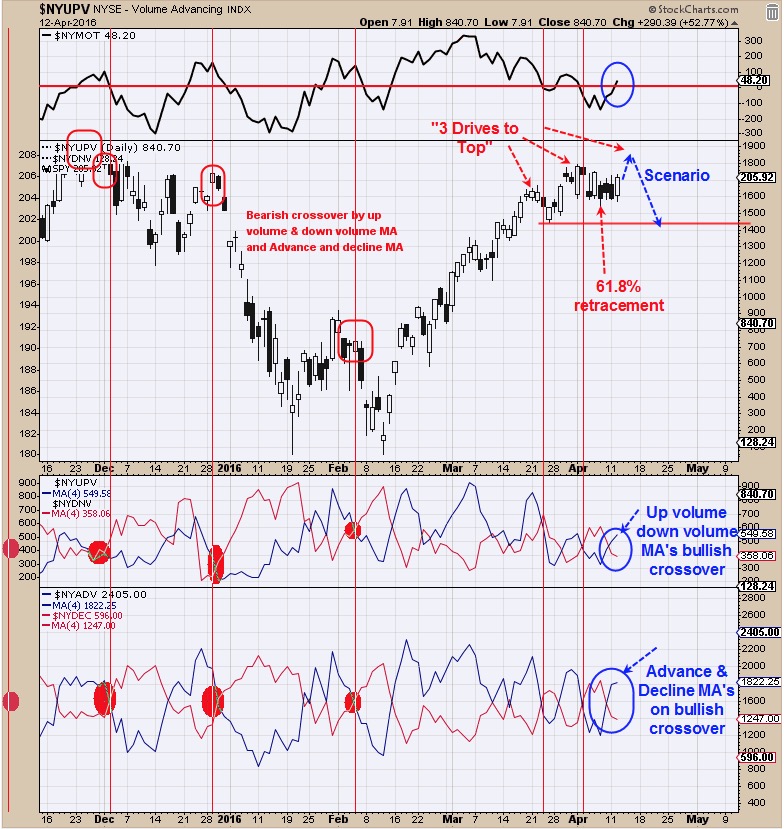
We showed this chart yesterday and its updated to today’s close. This week is option expiration week which usually has a bullish bias. The above chart looks at the very short term picture. The bottom window is the NYSE advancing issues with 4 period moving average and NYSE declining issues with 4 period moving average. Yesterday this indicator had a bullish crossover and remains on a bullish crossover today. Next window up is the NYSE up volume with 4 period moving average and NYSE down volume with 4 period moving average and this indicator also had a bullish crossover and it too remains on a bullish crossover. The top window is the NYSE McClellan Oscillator which closed above “0” and bullish for short term. We are thinking the April 1 high near 207 on the SPY will be tested before a larger decline may develop. The pattern that may be forming is “Three Drive to Top” and market needs one more high to complete this pattern. A bearish sign will be if the SPY makes a new short term high and the VIX makes a higher low.
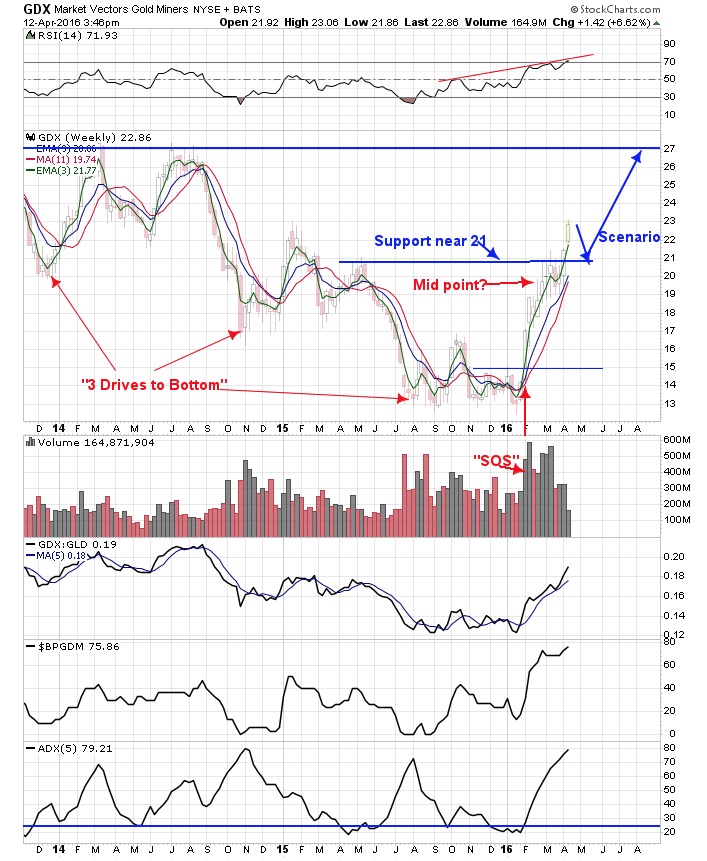
The Gold Commercials came in at -207,245 contracts as of 4/8/16; previous week reading was minus 207,964 contracts. Though gold may stubble short term the gold stocks may stay strong. Yesterday we looked at the monthly GDX chart and above is the weekly chart and both are in the bullish mode. Yesterday GDX jumped above the march 2016 high as well as the May 2015 high with a “Sign of Strength” suggests a valid breakout. If the rally is robust on the breakout (which it was), a pull back to the breakout area is common and we think that may unfold in the coming days. In past reports, we mentioned the possibility that a large “Three Drives to Bottom” was forming and this pattern has a minimum upside target to where the pattern began and in this chase would present a target near 27.00. Its common for sideways consolidation to mark the half way point of the move and March’s sideways consolidation would also give a target to 27.00 range. The picture is bullish, and a consolidation to 21.00 is possible where we expect the market to find support.
Tim Ord,
Editor
For examples in how "Ord-Volume" works, visit www.ord-oracle.com. New Book release "The Secret Science of Price and Volume" by Timothy Ord, buy on www.Amazon.com.